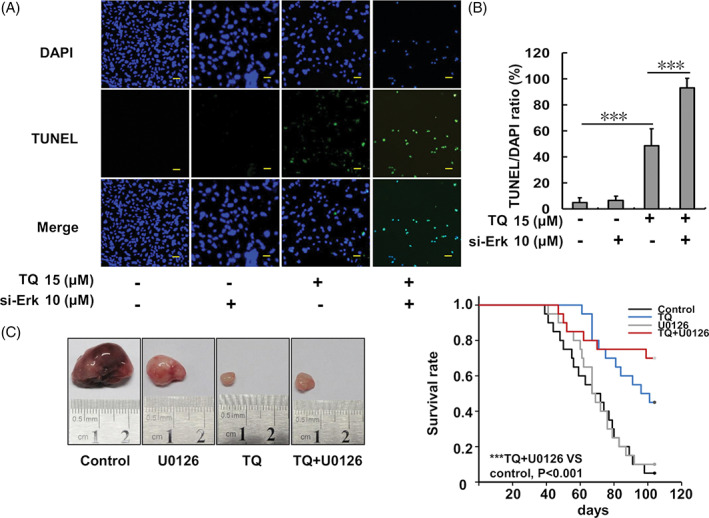
FIGURE 7.

Analysis of SK‐Hep1 cell apoptosis analysis following TQ and si‐Erk treatment and the animal model. (A) Cell apoptosis evaluation using DAPI and TUNEL staining assays. (B) The TUNEL/DAPI ratio of SK‐Hep1 cells after TQ and si‐Erk treatments. (C) BALB/c‐nu mouse survival curve and a representative tumor following SK‐Hep1 xenograft and the indicated treatments. Survival curve analysis by Kaplan–Meier analysis and the log rank test is shown. A statistically significant difference was observed between survival curves (p < .001). For all pairwise multiple comparison procedures (Holm‐Sidak method) the significance level = 0.05. TQ versus control, p = .00171; TQ + U0126 versus control, p = .000193; TQ versus U0126, p = .00584; TQ + U0126 versus U0126, p = .00116; TQ versus TQ + U0126, p = .36; control versus U0126, p = .752 (***p < .001 compared to the control group). TQ, thymoquinone
