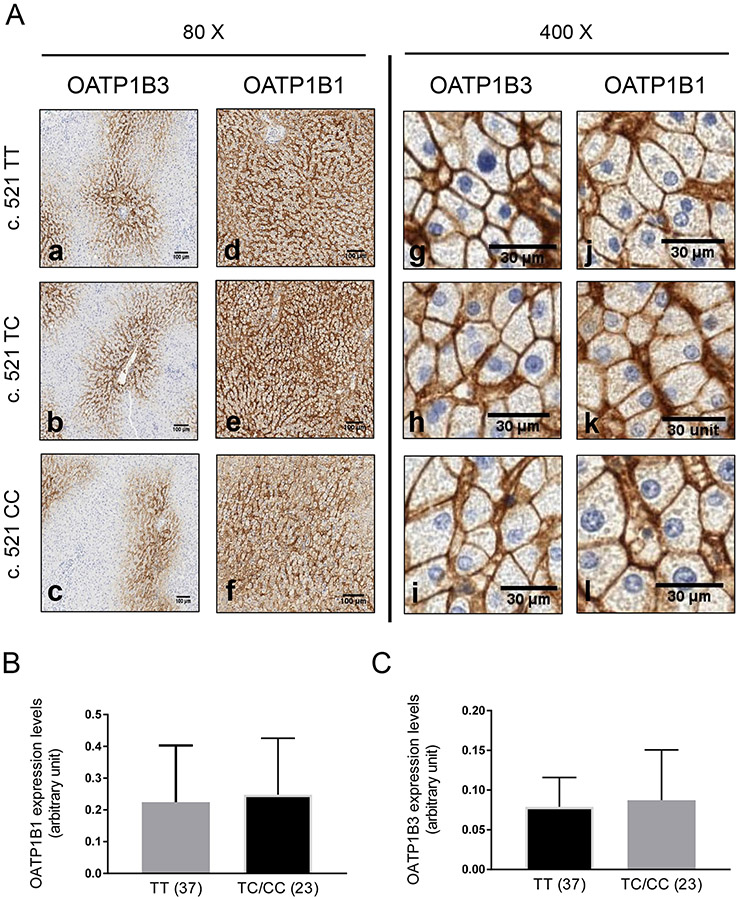
Fig. I. OATP1B1 and OATP1B3 expression in OATP1B1 c. 521 T>C genotyped human liver tissues.
A. Paraffin-embedded liver sections (4 μm) stained (brown signal) with OATP1B3 (a-c and g-i) and OATP1B1 (d-f and j-l) antibody, detected by DAB-HRP complex. Representative images from n=79 genotyped human liver tissue are shown. Semi-quantification of OATP1B1 (B) and OATP1B3 (C) expression in non-HCV and non-cirrhotic human livers genotyped for c.521 TT (n=37) and TC/CC (n=23) as detailed in Materials and Methods. Statistical analysis was conducted by student t-test.

