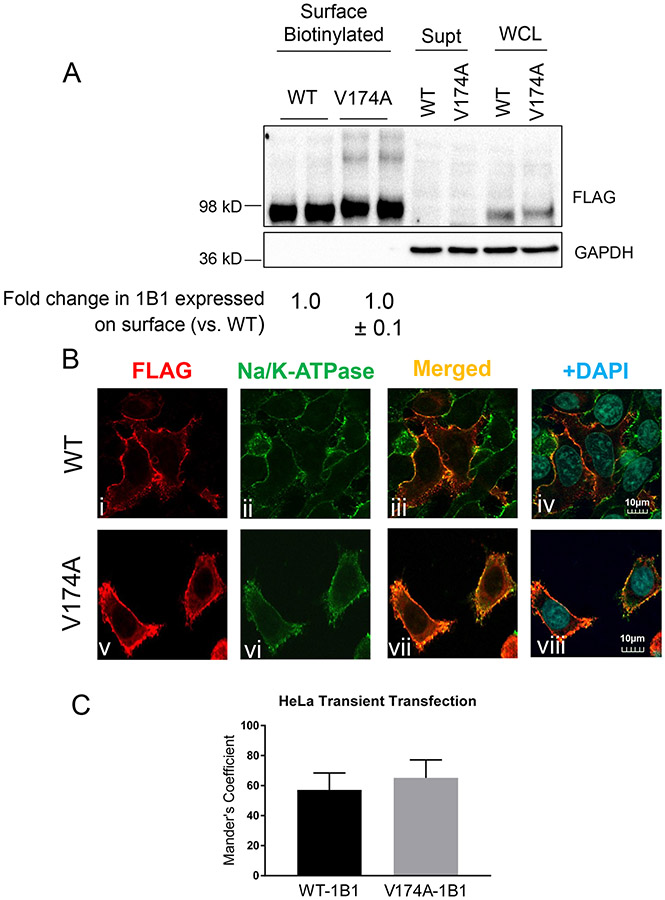
Fig. V. Determining plasma membrane localization of V174A- and WT-OATP1B1 in HeLa cell lines.
A. Protein levels of FLAG-WT- and FLAG-V174A-OATP1B1 in whole cell lysates (WCL), biotinylated plasma membrane fraction, and supernatant after NeutrAvidin adsorption. GAPDH was used as a cytoplasmic protein marker. Densitometry of WT- and V174A-OATP1B1 was determined in each fraction. Densitometry of OATP1B1 in the surface fraction was divided by the sum of the densitometry in the surface fraction and supernatant after scaling up to the same amount of proteins as was used in the surface fraction. A mixed-effect model was used to compare the surface levels of OATP1B1 between V174A- and WT-OATP1B1 as described in the Materials and Methods. Model-estimated fold change and associated SE of the surface expression of V174A-OATP1B1 vs. –WT-OATP1B1 is shown (n=3 in duplicate). B. Immunofluorescence staining of FLAG and Na/K-ATPase in HeLa cells transfected with FLAG-WT-OATP1B1 (WT) or FLAG-V174A-OATP1B1 (V174A). Co-immunofluorescence staining of FLAG-tagged WT- or V174A-OATP1B1 (red) and Na/K-ATPase (green) was performed in transfected HeLa cells as indicated. Nuclei were counterstained with DAPI (blue). Yellow shows co-localization of FLAG-tagged OATP1B1 and Na/K-ATPase. Images were taken using an Olympus FV10i confocal microscope at a resolution of 1024x1024 and 120X objective. Representative images from the same experiment are shown (n=3 independent experiments). To quantify the percentage of FLAG-OATP1B1 co-localized with the Na/K-ATPase surface marker, the Mander’s Coefficient was calculated in (C) transiently transfected HeLa cells as detailed in the Methods section. Data represent mean ± SD (n≥8 images in each group).

