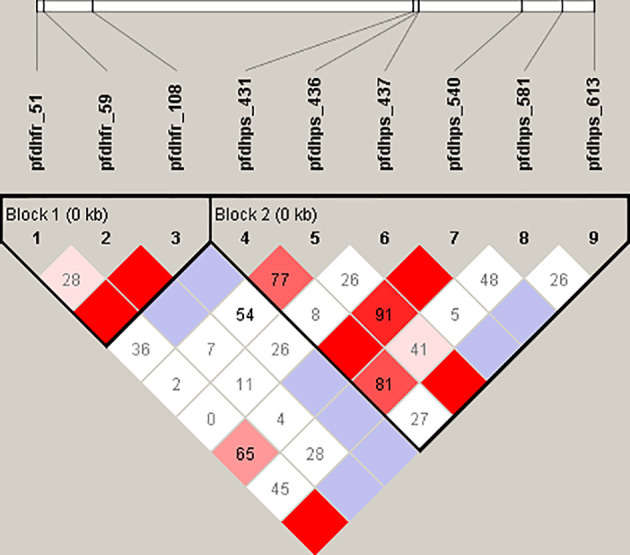
Figure 2.

Linkage disequilibrium (LD) analysis of pfdhfr and pfdhps SNPs. For the pfdhfr gene, the single amino acid mutations were N51I, C59R, and S108N, respectively. Likewise, pfdhps gene are related to the mutations S436A, A437G, K540E, and A613S, respectively. The dark and light red squares indicate a linkage that was statistically significant (P < 0.05). Cambridge blue squares indicate a linkage that is present but is not statistically significant (P > 0.05). A white square with indicates that no linkage is present.
