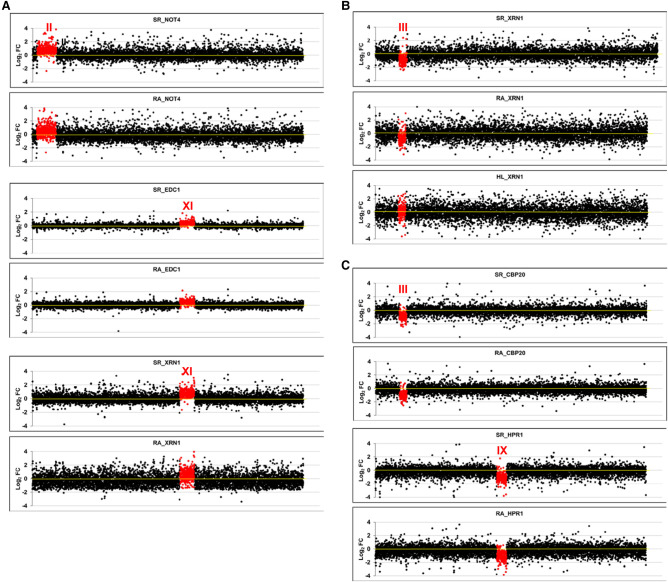
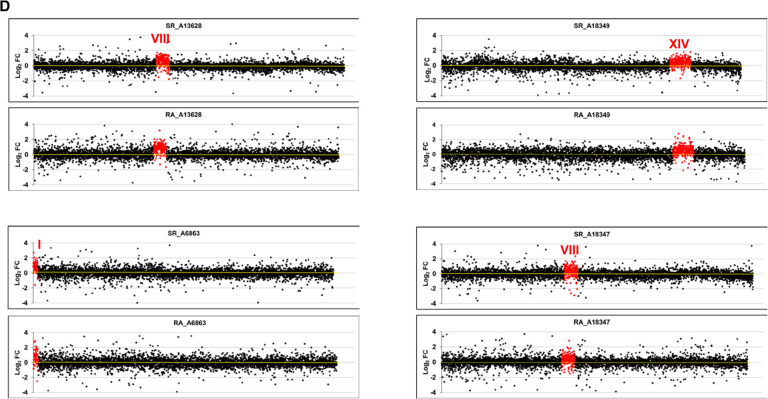
FIGURE 1.
Transcriptomic analysis of aneuploid strains. We performed GRO or a cDTA analysis of aneuploid strains compared to their wild-type strain (BY4741). Then we compared the fold changes of the synthesis rates (SR), mRNA amounts (RA), and mRNA half-lives (HL) of the genes aligned from the left to right telomeres in each chromosome ordered from chromosome I (left) to chromosome XVI (right) on a log2 scale. The genes from the aneuploid chromosome (marked as a roman numeral) are highlighted in red. (A) The results of the cDTA analysis of haploid strains not4, edc1, and xrn1. (B) The results of the GRO analysis of the xrn1 diploid strain from Haimovich et al. (2013) showing the SR, RA and HL data. The calculated HLs from the RA and SR data indicate how chromosome III has no average HL that differs from the other chromosomes. (C) The results of the cDTA analysis of diploid strains cbp20 and hpr1. (D) The results of the GRO analysis of a set of diploid (left) and haploid (right) strains from A. Amon's aneuploid collection (Torres et al. 2007). Note that the HL plot is shown only in the xrn1 mutant for simplification. In all cases, the absence of chromosome-specific variation in HL (see Table 1) indicates the absence of a gene-specific buffering system. Data used in these figures are available in Supplemental Tables S2, S3.


