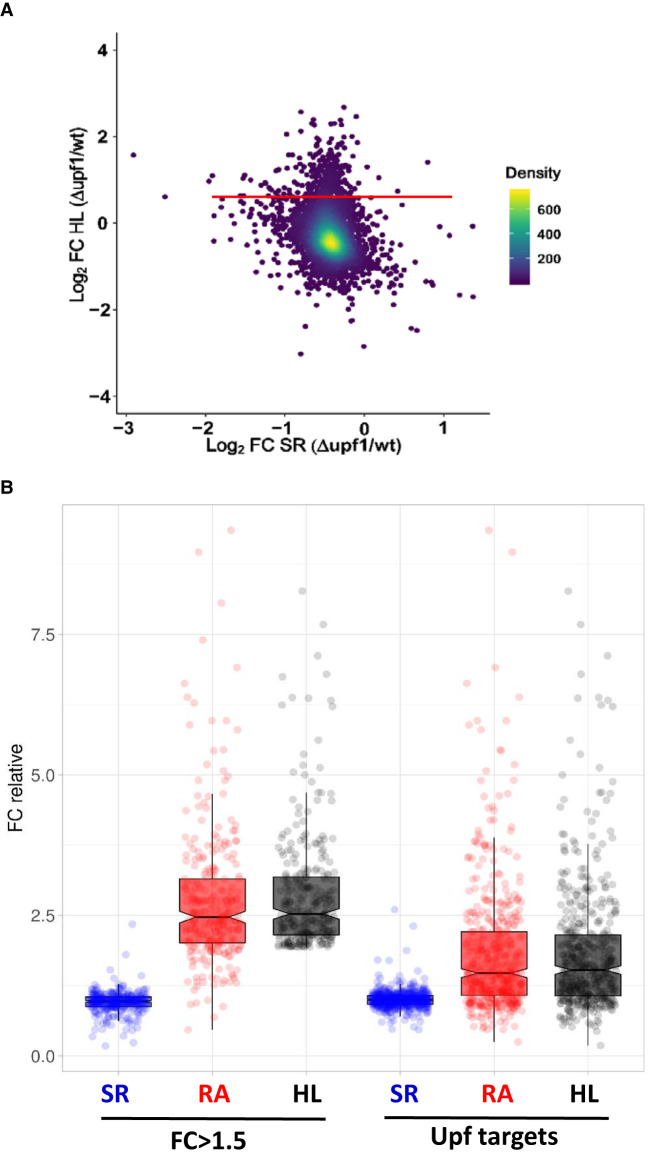
FIGURE 3.
Transcriptomic analysis of the upf1 mutant. We performed a GRO analysis of the upf1 mutant compared to its wild-type (WT) strain (BY4741). (A) Fold change (FC) in the mutant as regards the WT of half-lives (HL) versus the FC of the synthesis rates (SR) on the log2 scale. The red line marks the mRNAs with FC = 1.5 in the absence of the Upf1 protein. (B) Box-plot showing the fold-changes (FC) between the upf1 mutant and the wild-type strain for the groups of mRNAs with FC > 1.5 (left) and 496 Upf targets (Celik et al. 2017) (right). Data are relative to the population median taken as 1. The median values for the synthesis rates (SR), mRNA amounts (RA), and mRNA half-lives (HL) are shown in the plots. The experiment was run in triplicate. Data used for this figure are available in Supplemental Table S4.

