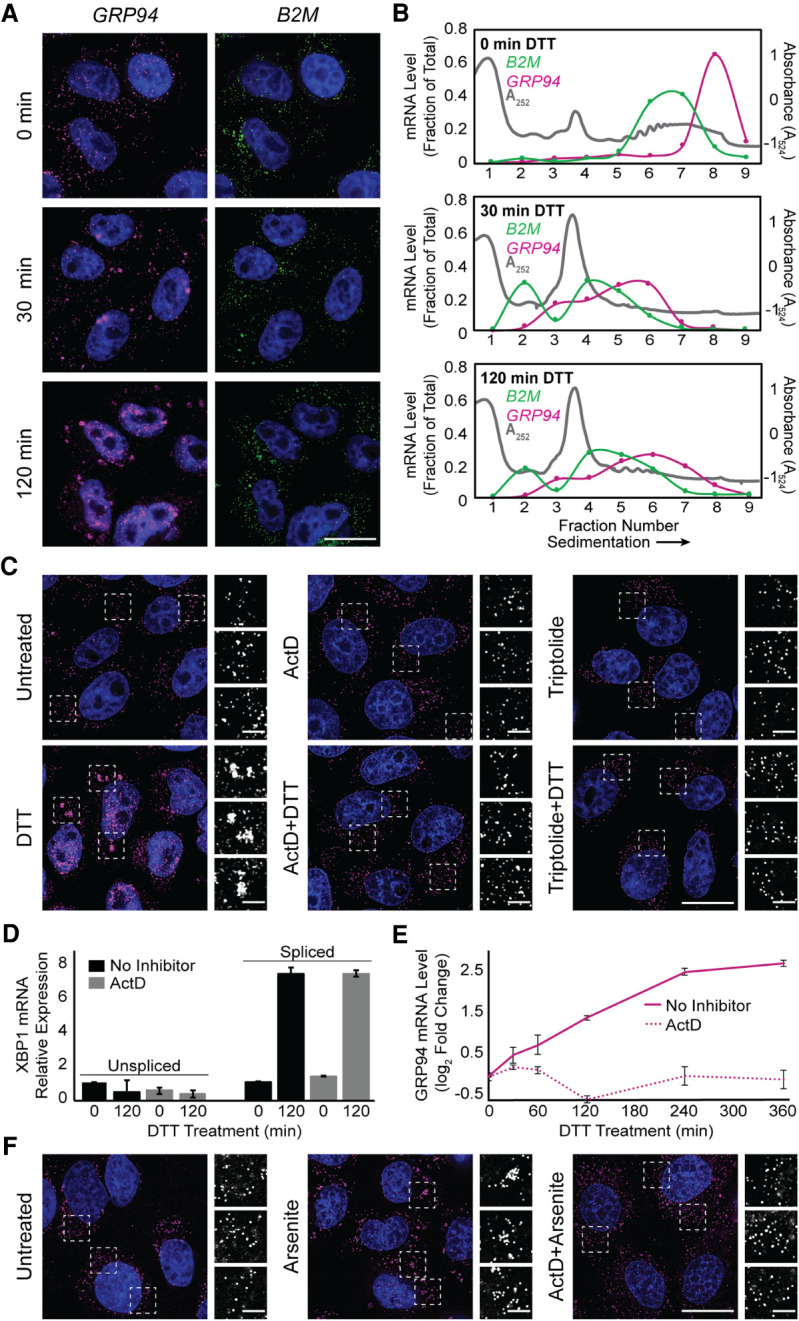
FIGURE 3.

Transcriptional inhibitors actinomycin D and triptolide prevent RNA recruitment into stress granules. (A) Representative time course analysis of GRP94 (magenta) and B2M (green) smFISH staining patterns over the course of maximal inhibition of eIF2α activity (see Fig. 1A). (B) Sucrose density velocity sedimentation gradients and RT-qPCR analysis as in Figure 1D at the indicated time points following DTT addition. Data are representative of three biological replicates. (C) Representative GRP94 smFISH in control (untreated, ActD, triptolide) and stressed (treatment with DTT, with and without treatment with indicated transcriptional inhibitor, ActD or triptolide) conditions. Boxes indicate regions of grayscale insets of mRNA distributions (right). (D) RT-qPCR analysis of spliced and unspliced XBP1 mRNA in control (untreated or ActD) and stressed (treatment with DTT, with and without ActD) conditions. Data are expression level relative to 0 min without ActD after normalization to GAPDH ± SEM from three biological replicates. (E) RT-qPCR analysis of GRP94 mRNA levels over a time course of DTT treatment with or without ActD addition. Data are mean log2 fold change of expression relative to GAPDH ± SEM from three biological replicates. (F) Representative GRP94 smFISH in untreated and sodium arsenite-treated cells with or without ActD addition. Dotted boxes indicate regions of grayscale insets of mRNA distribution (right). DAPI staining (blue) is included for all images. Full cell scale bar = 20 µm, inset scale bar = 4 µm.
