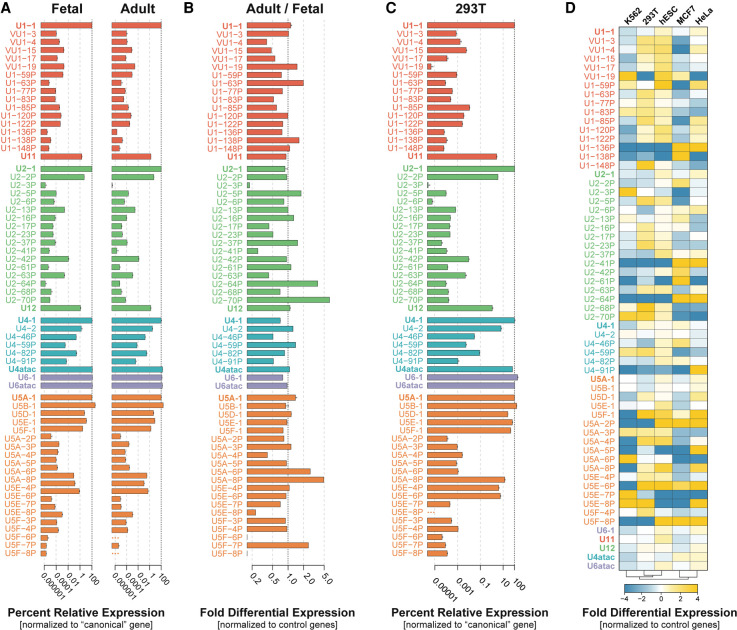
FIGURE 2.
Multiple snRNA gene variants are transcribed in human cells. (A) Expression of snRNA variants in pooled adult and fetal tissues relative to the respective canonical gene (2−ΔCt) using RT-qPCR. U6 snRNA was normalized to canonical U4 snRNA. Error bars represent the standard error of the mean (SEM) of three technical replicates. The x-axis is log10 scaled. (B) Fold differential expression of snRNA variants in pooled adult versus fetal tissues. Normalized ratios of expression between adult and fetal tissues are displayed (2−ΔΔCt). Ratios >1 indicate greater relative expression of the snRNA in adult tissues. Ratios <1 indicate greater relative expression in fetal tissues. (C) Expression of snRNA variants in 293T cells relative to the respective canonical gene (2−ΔCt) using RT-qPCR. U6 snRNA was normalized to canonical U4 snRNA. (See Supplemental Fig. 4A for expression of a subset of snRNAs relative to U1-1.) Error bars represent the standard error of the mean (SEM) of three technical replicates from human 293T cell RNA. The x-axis is log10 scaled. (D) Heat map of the fold differential expression of the snRNA genes listed at left across the human cell lines listed at top, as determined by RT-qPCR and indicated by the color scale below. Cell lines were hierarchically clustered based on their snRNA expression profiles (bottom). Three technical replicates were run for each sample.

