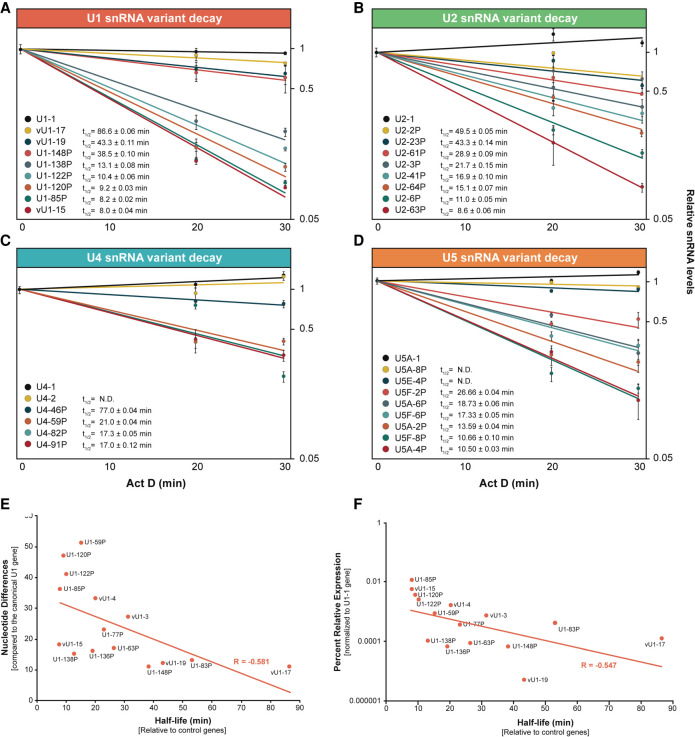
FIGURE 4.
Most snRNA variants are less stable than their canonical snRNA. RT-qPCR assays monitoring the relative level of snRNA variant remaining after onset of actinomycin D-mediated transcription inhibition. Half-lives (t1/2) were calculated after normalization of snRNA levels to the mean of 7SK and 5S RNA levels. (A–D) Data and values for selected U1, U2, U4, and U5 variants, respectively; see Supplemental Table S4 for all values. Error bars represent the SEM of three technical replicates from each time point. (E) Scatter plot comparing U1 variant nucleotide differences (from Supplemental Table S3) versus snRNA half-life (from Supplemental Table S4). Linear regression line and correlation coefficient (R) are indicated in red. (F) Scatter plot comparing the relative expression levels of U1 variants (log10; Fig. 2D) versus snRNA half-life (Supplemental Table S3). Linear regression line and correlation coefficient (R) are indicated in red.

