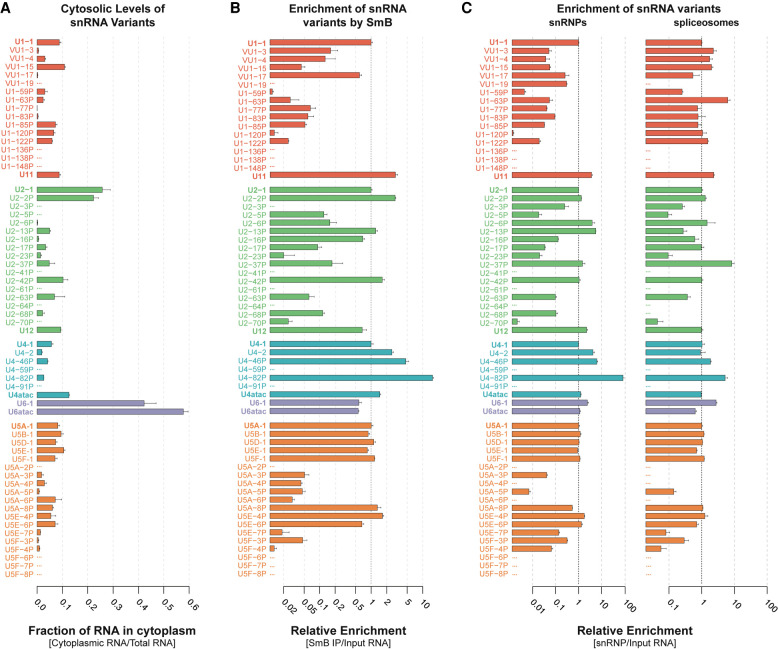
FIGURE 5.
Most snRNA variants are incorporated into spliceosomes. (A) Cytosolic fraction of variant snRNAs. Nuclear and cytoplasmic fractions were normalized using cell equivalents to calculate total RNA. Error bars represent the SEM of three technical replicates from each fraction. (B) Enrichment of snRNA variants by anti-Sm (Y12 mAb) IP relative to canonical snRNAs. Fold enrichment was calculated as 2-(Ct variant - Ct canonical) for Y12 IP/2-(Ct variant - Ct canonical) for Total RNA. Error bars represent the SEM of three technical replicates. The x-axis is log2 scaled. See Supplemental Figure 7C for relative levels in Y12 mAb IP. (C) Enrichment of snRNA variants in snRNP and spliceosome fractions relative to canonical snRNAs. Fold enrichment was calculated as 2-(Ct variant - Ct canonical) for snRNP or spliceosomes /2-(Ct variant - Ct canonical) for Total RNA. Error bars represent the SEM of three technical replicates. The x-axis is log10 scaled. See Supplemental Figure 7E for relative levels in snRNPs or snRNPs or spliceosomes.

