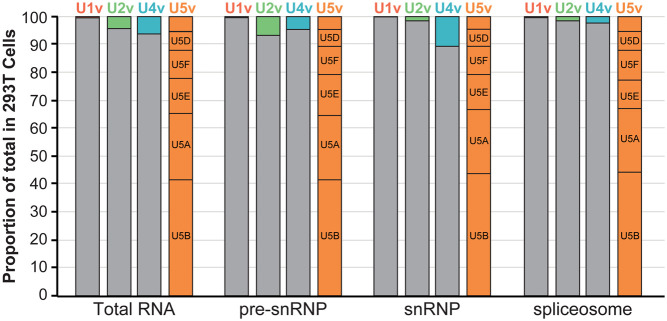
FIGURE 6.
snRNA variants are expressed and incorporated into splicing complexes. Histogram of the proportion of canonical (gray) versus variant (colored) snRNAs from total RNA, Sm IPs, snRNPs, and spliceosomes isolated from 293T cells. For U5 snRNA, the five major variants are labeled, and the unlabeled box corresponds to the sum of the three minor variants. The x-axis is log10 scaled.

