
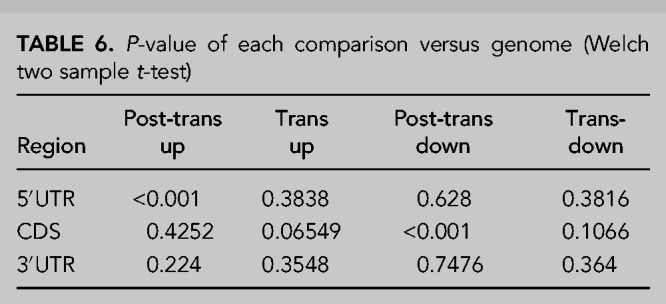
TABLE 6.
P-value of each comparison versus genome (Welch two sample t-test)
Official websites use .gov
A
.gov website belongs to an official
government organization in the United States.
Secure .gov websites use HTTPS
A lock (
) or https:// means you've safely
connected to the .gov website. Share sensitive
information only on official, secure websites.
P-value of each comparison versus genome (Welch two sample t-test)