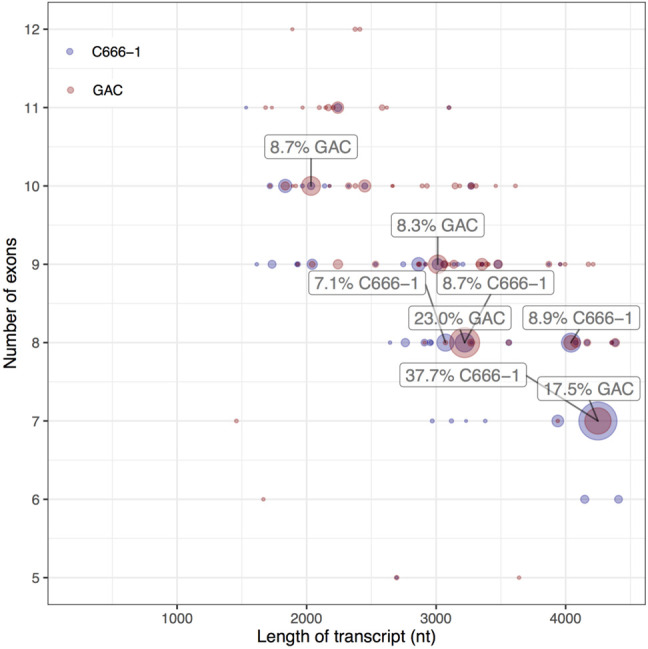
FIGURE 4.

Diversity plot of high-confidence data. Each dot represents a unique transcript variant and the area correlates with the number of supporting reads expressed as percentage of fully annotated reads. The 4.2 kb splice form represents 37.7% and 17.5% of the reads in the C666-1 and GAC library, respectively. Splicing within long exons pulls the center of density toward shorter transcripts with more exons. Transcript variants comprising <5 exons (equivalent to 0.26% of the data) are not shown.
