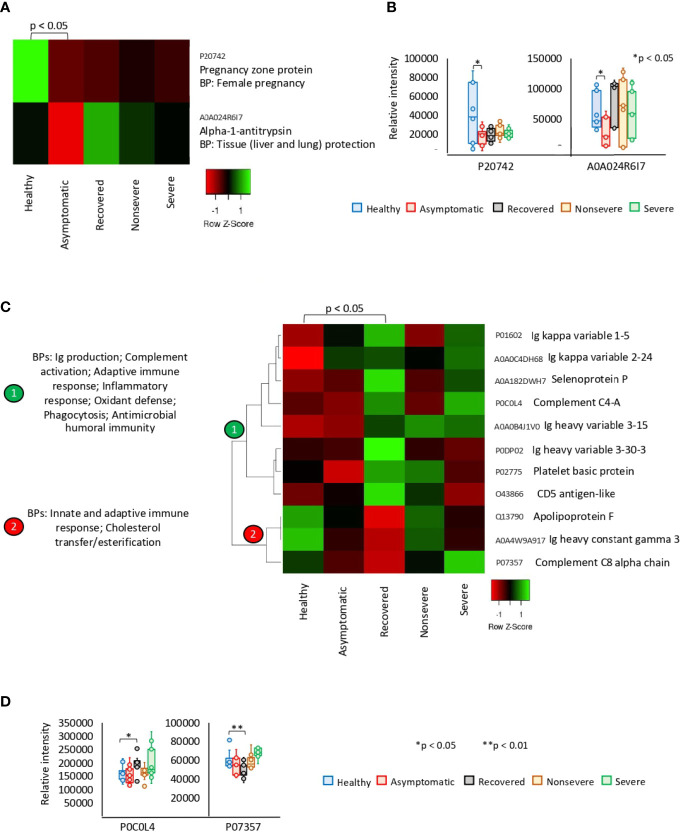
Figure 2.
Exclusive differential representation of proteins in sera from COVID-19 asymptomatic and recovered cases. (A) Heatmap of proteins significantly dysregulated (Z-scored original value) in asymptomatic cases only (p < 0.05; unpaired two-sided Welch’s t-test). Biological process (BP) is shown for each protein. (B) Change in levels of two selected proteins with significant differences between asymptomatic cases and healthy controls (*p < 0.05; unpaired two-sided Welch’s t-test). (C) Heatmap of proteins significantly dysregulated (Z-scored original value) in recovered cases only (p < 0.05; unpaired two-sided Welch’s t-test). Biological processes (BPs) are shown for each cluster of proteins differentially represented in response to COVID-19 (cluster 1, overrepresented; cluster 2, underrepresented). (D) Change in levels of two selected proteins with significant differences between recovered cases and healthy controls (*p < 0.05, **p < 0.01; unpaired two-sided Welch’s t-test).

