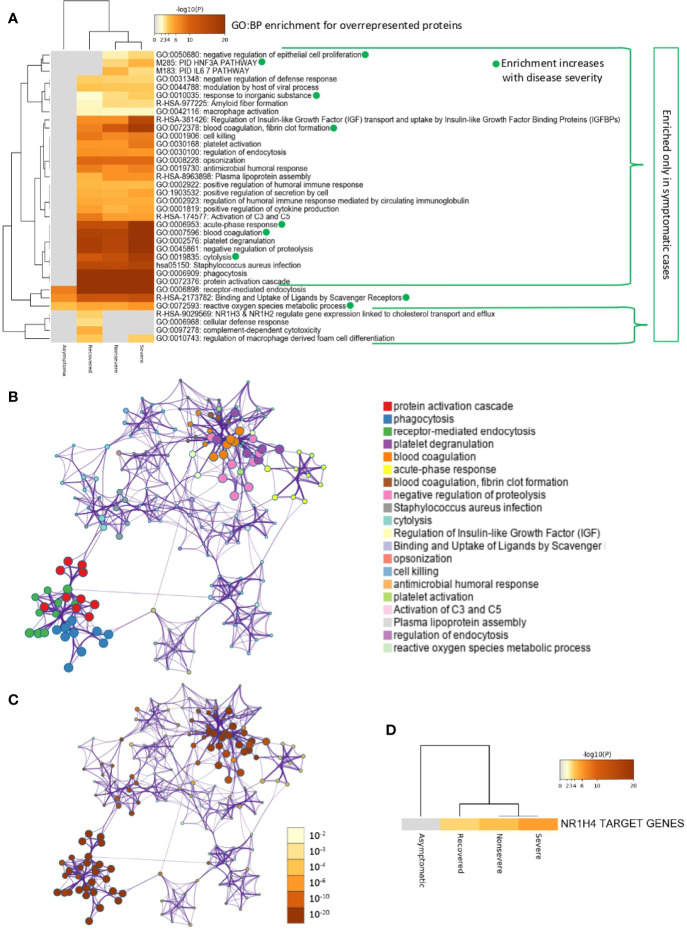
Figure 5.
Enrichment ontology clusters for differentially overrepresented proteins in sera from COVID-19 cases. (A) Statistically enriched terms (GO/KEGG biological processes; GO : BP). Accumulative hypergeometric p-values and enrichment factors were calculated and used for filtering. Remaining significant terms were then hierarchically clustered into a tree based on Kappa-statistical similarities among their protein memberships (as used in DAVID Bioinformatics Resources 6.8; https://david.ncifcrf.gov). A 0.3 Kappa score was applied as the threshold to cast the tree into term clusters. The term with the best p-value within each cluster was selected as its representative term and displayed in a dendrogram. The heatmap cells are colored by their p-values; white cells indicate the lack of enrichment for that term in the corresponding gene list. BPs in which enrichment increased with disease severity only in symptomatic cases are shown. (B) Network of enriched terms. We selected a subset of representative terms from the full cluster and convert them into a network layout. More specifically, each term is represented by a circle node, where its size is proportional to the number of input genes that fall into that term, and its color represents its cluster identity (i.e., nodes of the same color belong to the same cluster). Terms with a similarity score > 0.3 are linked by an edge (the thickness of the edge represents the similarity score). The network is visualized with Cytoscape (v3.1.2) with “force-directed” layout and with edge bundled for clarity. One term from each cluster is selected to have its term description shown as label. (C) Network of enriched terms colored by p-value. The same enrichment network has its nodes colored by p-value, as shown in the legend. The darker the color, the more statistically significant the node is (see legend for p-value ranges). (D) Quality control and association analysis. Protein lists were identified in the ontology categories Transcription_Factor_Targets. All genes in the genome were used as the enrichment background. Terms with a p-value < 0.01, a minimum count of 3, and an enrichment factor (ratio between the observed counts and the counts expected by chance) > 1.5 were collected and grouped into clusters. The algorithm used here is the same as that used in the other enrichment analyses.

