
Fig. 2.
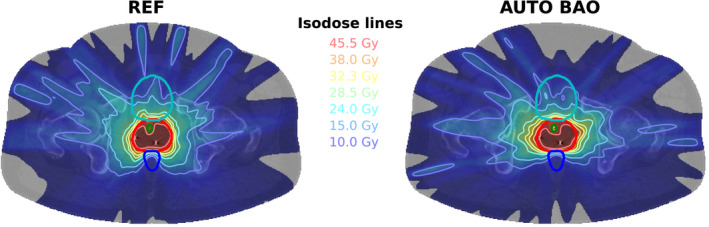
An example dose distribution for REF (left) and AUTO BAO (right). Depicted structures: PTV (red), Urethra (green), Rectum (dark blue), and Bladder (light blue).
Official websites use .gov
A
.gov website belongs to an official
government organization in the United States.
Secure .gov websites use HTTPS
A lock (
) or https:// means you've safely
connected to the .gov website. Share sensitive
information only on official, secure websites.
An example dose distribution for REF (left) and AUTO BAO (right). Depicted structures: PTV (red), Urethra (green), Rectum (dark blue), and Bladder (light blue).