
Figure 4.
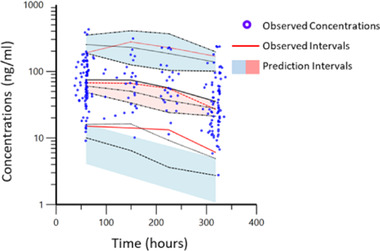
Visual predictive check of riluzole population pharmacokinetic model. Individual observations are presented by the blue dots. The 5th, 50th, and 95th percentiles of observed data are presented by the red lines. The 5th, 50th, and 95th percentiles of predicted data are presented by the black lines.