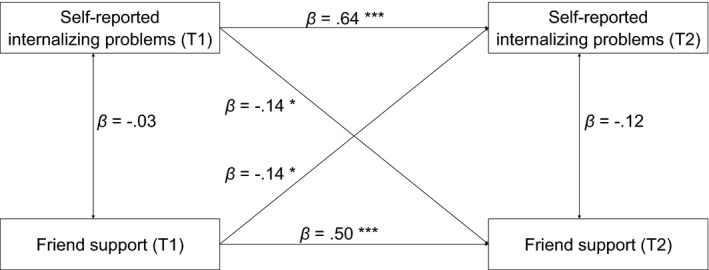
Figure 2.

Graphical representation of results for Model 1 (self‐reported internalizing problems).
Note. Not all terms that were included in the model are displayed in the figure. *p < .05, ***p < .001.

Graphical representation of results for Model 1 (self‐reported internalizing problems).
Note. Not all terms that were included in the model are displayed in the figure. *p < .05, ***p < .001.