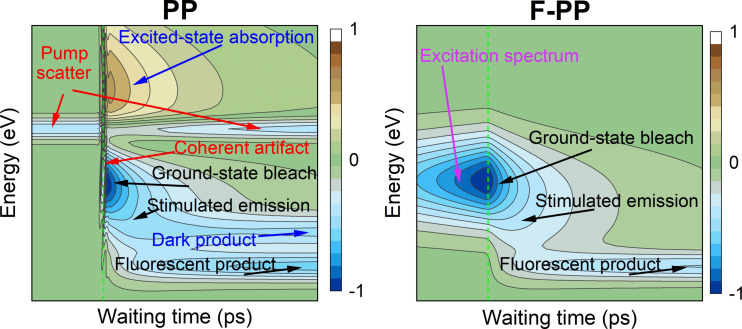
Figure 5.
General features present in the transient spectra of standard pump–probe (PP, left) and its fluorescence‐detected variant (F‐PP, right). The colored maps indicate transient spectra (vertical axis) evolving in the waiting time (horizontal axis). Time zero is indicated by a green dashed line. Features present in both techniques are labeled in black. Features labeled in red are present in PP only and do not reflect the system dynamics. Features labeled in blue are typically present in PP only, while the feature in pink is exclusive for F‐PP. Data were calculated assuming exponential kinetics convoluted with a Gaussian instrument response function (pulse cross‐correlation), Gaussian line shapes of all features, and a cosine‐modulated coherent artefact.

