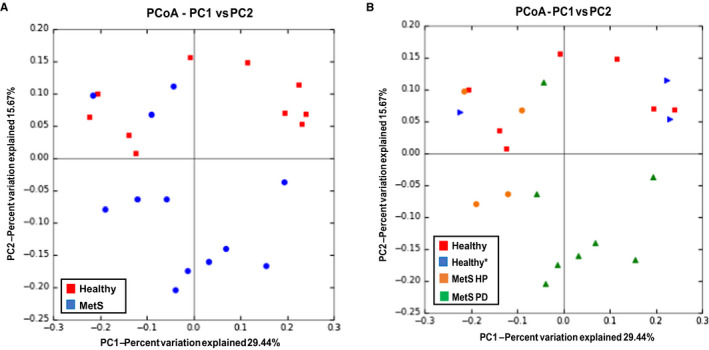
FIGURE 2.

Principal coordinate analysis (PCoA) for all groups show the relative relatedness within groups. A two‐dimensional view of the three‐dimensional PCoA plot, derived from UniFrac as a distance metric, is shown in A, representing beta diversity for the two‐group analysis. It can be appreciated that the two groups appear to be more related within group than between group as evidenced by clusters. A two‐dimensional view of the three‐dimensional PCoA plot, derived from UniFrac as a distance metric, is shown in B, representing beta diversity for the four‐group analysis. No conclusive result regarding beta diversity can be observed from these plots. MetS, metabolic syndrome; MetS HP, metabolic syndrome with healthy periodontium; MetS PD, metabolic syndrome with periodontitis
