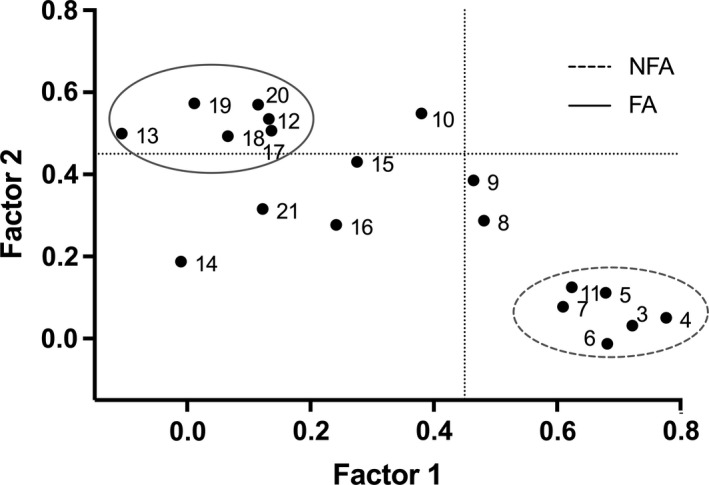
FIGURE 3.

Scatterplot of EFA loadings. Scatterplot of exploratory factor analysis (EFA) loading of OBC items related to diurnal oral behaviours. On x‐axis and y‐axis, loadings are shown for factor 1 and factor 2. Numerals in the plot space refer to item numbers (see Table 1 for clarification). Circles with different line drawing represent OBC new scale (NFA and FA, see methods and results). Dotted line represents loading factor <0.45. The two identified factors represent a clean structure with, considering the exploratory nature of this analysis, an acceptable/good consistency (Cronbach's alpha: 0.68 for FA and 0.81 for NFA)
