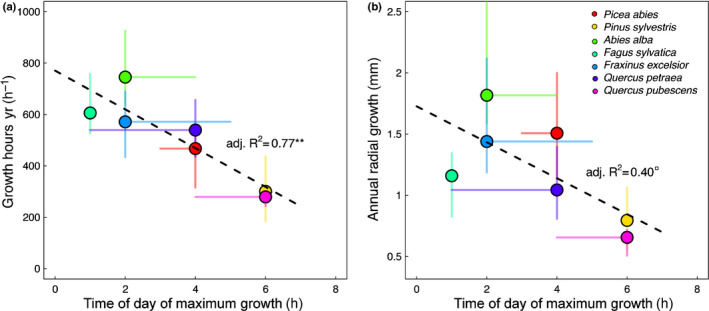
Fig. 5.

Time of day of maximum growth in relation to (a) the number of hours with growth and (b) the radial stem increment per year. Shown are the medians (circles) and the range between the 25%‐ and 75%‐quantiles (lines) of each species (colour‐coded). Dashed lines show the linear regression. **, P < 0.01; □, P < 0.1.
