Fig. 1.

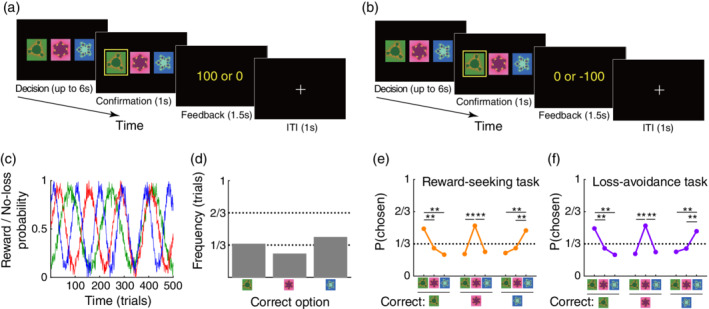
Experimental tasks. (a) Illustration of the reward‐seeking task. On each trial, participants selected one of the three options and either received a reward (100 JPY ~ 1 USD) or no‐reward (0 JPY) depending on the probability assigned to the chosen option. JPY, Japanese Yen. (b) Illustration of the loss‐avoidance task. On each trial, participants received a loss (−100 JPY) or no‐loss (0 JPY). (c) Reward and no‐loss probability for each option. The reward and no‐loss probabilities for the available options were identical between the two tasks. (d) Frequency of trials in which each of the three options had the highest reward or no‐loss probability (i.e. the correct option). (e) Proportion of each option chosen in the reward‐seeking task. Orange points and the error bars denote the mean and SEM across participants (n = 939). Note that the error bars overlap with the points. Left, the proportions when the green option had the highest reward probability (i.e. the correct option); middle, when the red option was the correct; and right, when the blue option was the correct. **P < 0.01; FDR‐corrected by the number of tests (i.e. 6) in a two‐tailed t‐test (corrected and uncorrected Ps < 0.001 for all the comparisons). (f) Proportion of each option chosen in the loss‐avoidance task (n = 961). Same format as in (e) (corrected and uncorrected Ps < 0.001 for all the comparisons).
