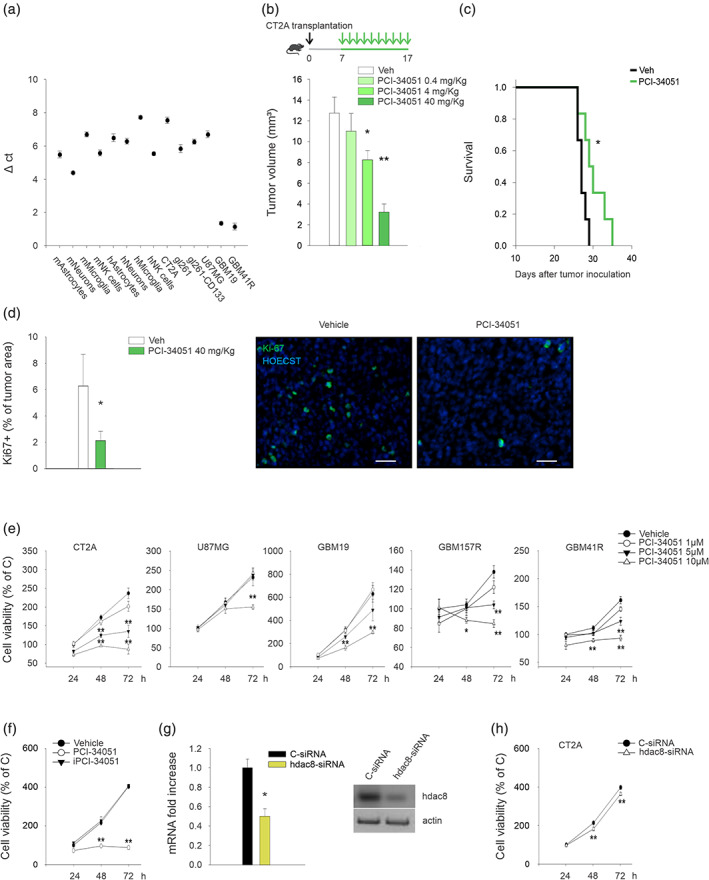
FIGURE 1.

HDAC8 inhibition affects glioma growth and increases mice survival. (a) RT–PCR analyses of hdac8 expression in tumor cells, normal cells, and human tissues from patients (n = 3). (b and c) mean tumor volume (b) and Kaplan–Meier curve (c) in CT2A‐bearing mice. Mice were treated with PCI‐34051, as indicated in the scheme on top (n = 7–8 mice per treatment; *P < 0.05 **P < 0.01, one‐way ANOVA). (d) Data show the Ki67+ cells in brain tumors (expressed as the mean area ± S.E.M. percentage of the tumor) at 17 days after glioma implantation in mice treated with PCI‐34051 40 mg/kg, as indicated (n = 4 mice per treatment; *P < 0.05, Student's t test). Representative immunofluorescence images of proliferating Ki67+ cells (green) under the two experimental conditions are shown on the right. Scale bars, 50 μm. (e) Growth curves of human and murine glioma cells treated with PCI‐34051 for the indicated time points. The results are expressed as percentage of vehicle‐treated cells ± S.E.M. (n = 4–7; *P < 0.05 **P < 0.01, one‐way ANOVA). (f) Growth curves of CT2A glioma cells treated with PCI‐34051 or iPCI‐34051 10 μM for the indicated time points. The results are expressed as percentage of vehicle‐treated cells ± S.E.M. (n = 3; **P < 0.01, one‐way ANOVA). (g) RT‐PCR analysis of hdac8 expression in CT2A cells transfected with c‐ or hdac8‐siRNA for 48 h. one representative western blot analysis of HDAC8 protein in silenced cells is shown on the right. (n = 4; *P < 0.05, one‐way ANOVA). (h) Growth curves of CT2A glioma cells transfected with c‐ or hdac8‐siRNA. The results are expressed as percentage of c‐siRNA treated cells ± S.E.M. (n = 4; **P < 0.01, one‐way ANOVA)
