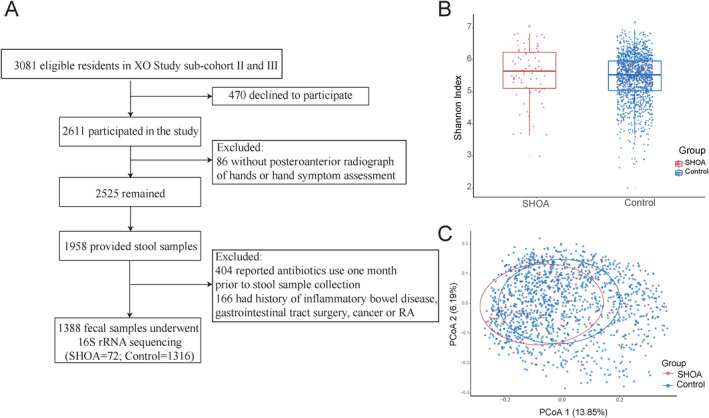
Figure 1.

Profiling of the gut microbiome using 16S ribosomal RNA (rRNA) sequencing in subjects from the Xiangya Osteoarthritis (XO) Study cohort. A, Selection process of study subjects with symptomatic hand osteoarthritis (SHOA) and those without symptomatic hand OA (controls). B, Shannon index of microbial diversity (α‐diversity) in each group. Results are shown as box plots, in which symbols represent individual subjects, the horizontal line inside the box represents the median, each box represents the 25th to 75th percentiles, and the lines outside the box represent the smallest and largest value of 1.5 × the interquartile range. C, Principle coordinates analysis (PCoA) plots of β‐diversity in each group, constructed using the unweighted Unifrac distance. RA = rheumatoid arthritis.
