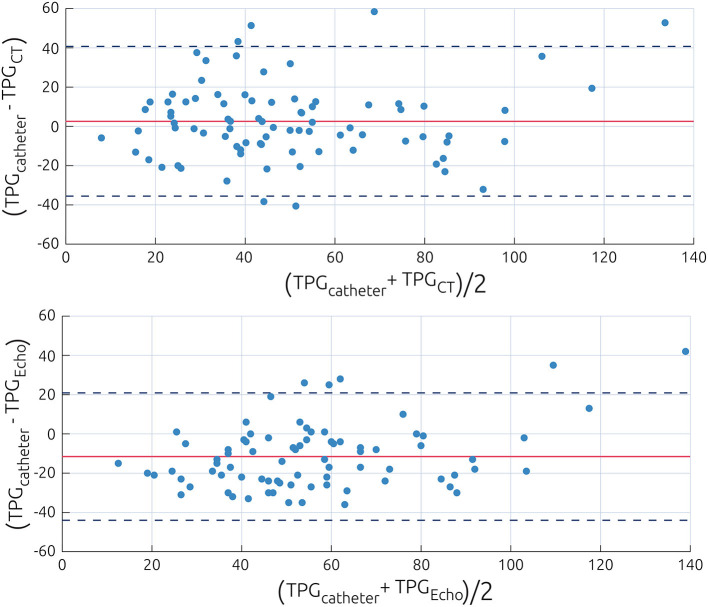
Figure 3.
Bland–Altman plot visualizing the differences between the catheter-based measurements of the pressure gradient and the non-invasive estimations using the power law model (Top) or Doppler echocardiography (Bottom). Data are presented as difference of both methods against the average of both methods. The value of the average prediction error is indicated by a solid line, whereas the dashed lines indicate the average prediction error ±1.96 times the standard deviation of this error.

