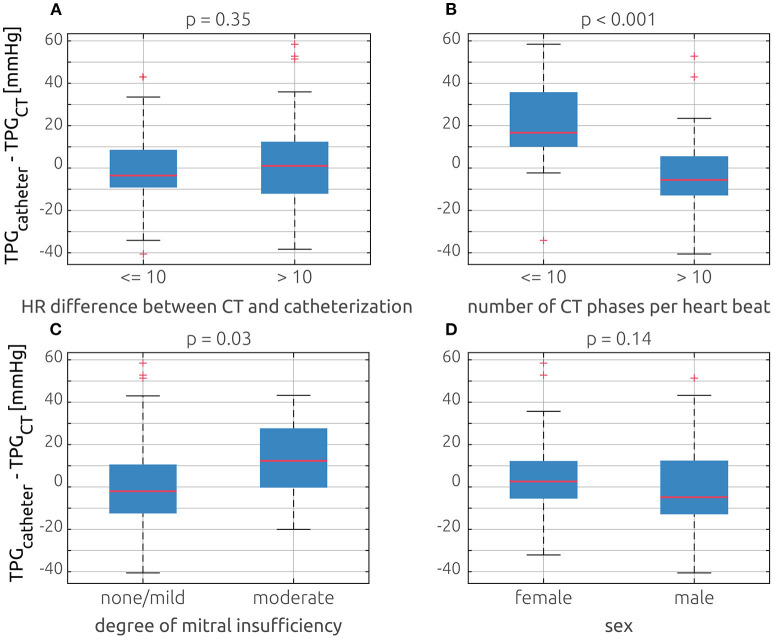
Figure 5.
Comparison of the model's prediction error (TPGcatheter – TPGCT) based on four different possible error sources using box plots: (A) comparison of patients who have absolute heart rate difference between catheterization and CT equal or below 10 bpm and patients whose difference exceeded that threshold. (B) Comparison of cases, where the dynamic CT had 10 or less phases per heartbeat and those with more phases. (C) Comparison of patients who had no or a mild mitral insufficiency and those with moderate insufficiency. (D) Comparison between female and male patients.

