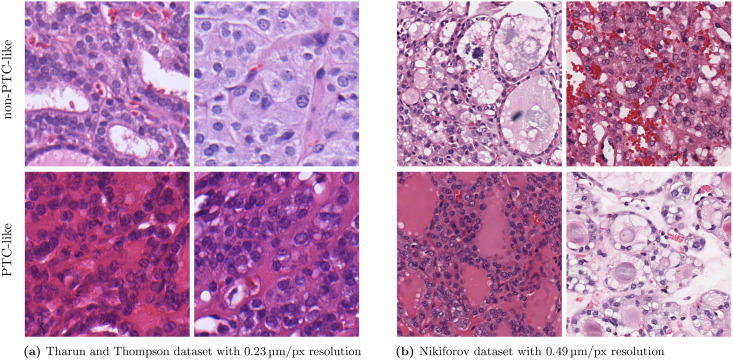
Fig 1. Example thyroid gland tumor images from the Tharun and Thompson dataset and the Nikiforov dataset.
The images are cropped to 512 × 512 px. The upper row shows non-PTC-like samples and the lower row shows PTC-like samples. A high-resolution version is available in S1 Fig.

