Fig 9.
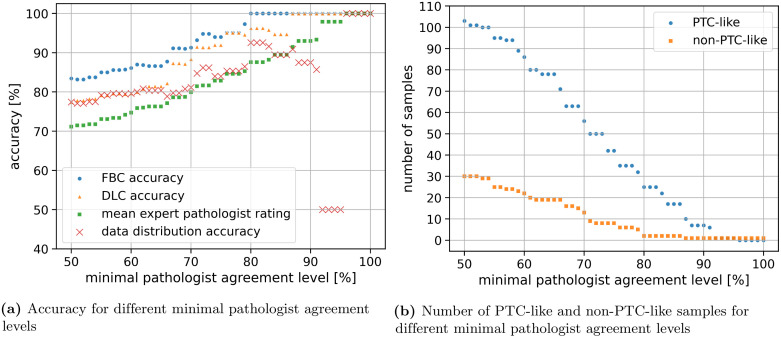
The evaluation on samples with a pathologist agreement level greater than a threshold is shown in (a). The feature-based classification (FBC accuracy, blue dots) outperforms the mean expert pathologist rating (green squares) and the accuracy achievable by knowing the data split (red crosses). The performance of the deep learning-based classification (DLC accuracy, orange triangles) varies between the FBC accuracy and the mean expert pathologist rating. The number of samples evaluated for different minimal pathologist agreement levels is shown in (b). The PTC-like samples are shown in blue dots and the non-PTC-like samples are shown in orange squares.

