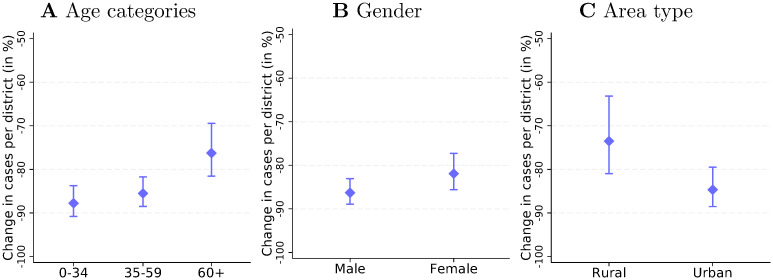
Fig 5. Heterogeneity of the social distancing effect on cases.
Notes: The three panels of Fig 5 show how the effect of the nationwide social distancing policies on April 2 differed across age groups (Fig 5A), by gender (Fig 5B), and between urban and rural districts (Fig 5C). The estimates rely on sample splits and show the percentage of confirmed COVID-19 cases avoided by the nationwide policies. The vertical lines represent 95% confidence intervals based on district-level-clustered standard errors.

