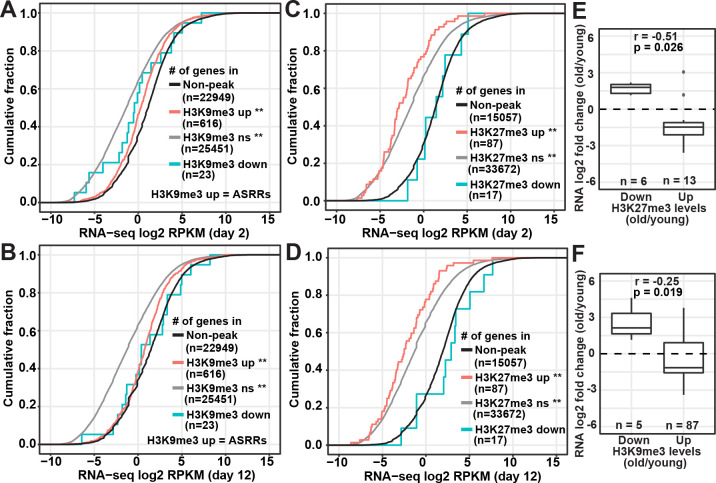
Fig 2. Anti-correlation between changes in repressive marks and gene expression.
(A-D) Cumulative frequency plots of the normalized RNA read counts (log2 RPKM) of genes associated with H3K9me3 (A and B) or H3K27me3 (C and D) peak regions versus genes in non-peak regions (black curves) in young (day 2) and old (day 12) germlineless glp-1(e2141) mutants. Repressive peak regions were divided into three groups based on age-dependent changes: significantly upregulated (up, red curves), significantly downregulated (down, cyan curves), and non-significant (ns, gray curves). Comparing to genes in the non-peak regions (black curves), genes associated with upregulated and non-significant repressive peak regions had significantly lower RNA expression levels (**, p-values of Kolmogorov–Smirnov test < 0.0001). The number of genes associated with a given set of peak regions is indicated in the parenthesis. Abbreviation: ASRRs, aging-specific repressive regions. (E and F) Box plots comparing age-dependent RNA expression fold change (log2) of differentially expressed genes associated with significantly upregulated or downregulated H3K27me3 (E) or H3K9me3 (F) peaks. The numbers of differentially expressed genes (n) associated with individual groups of peak regions are indicated in the figures: 87 and 5 genes associated with the 578 upregulated and 17 downregulated H3K9me3 peaks, and 13 and 6 genes associated with the 59 upregulated and 7 downregulated H3K27me3 peaks, respectively. Pearson’s correlation coefficient (r) and p-value of the correlation between fold changes in RNA expression and histone modifications are indicated on the top of each panel.

