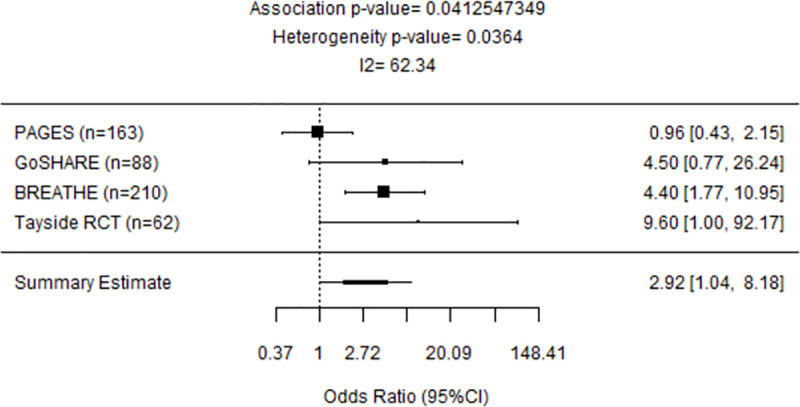
Fig 2. Forest plot representing meta-analysis of the association between LTA4H rs2660845 and outcomes observed across early-onset PAGES, GoSHARE(b), BREATHE and Tayside RCT studies.

Study sample size is in parentheses. Squares represent the odds ratio (OR), horizontal lines represent 95% confidence intervals (CIs). The diamond in the bottom represents summary estimate combining the study-specific estimates using a random effects model.
