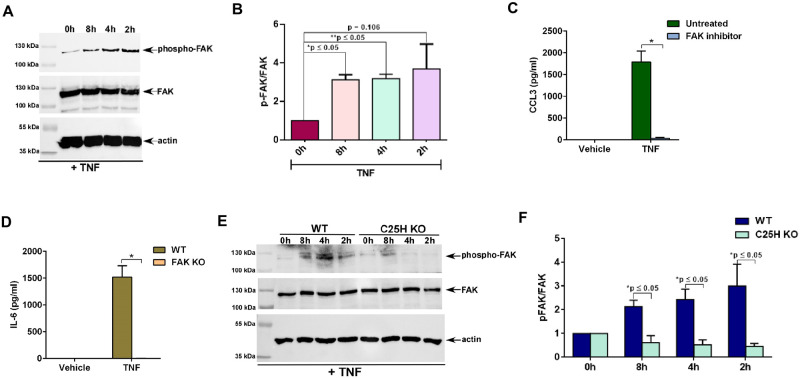
Fig 3. 25HC produced by TNF activates FAK and FAK activation is required for optimal TNF-mediated pro-inflammatory response and NFκB activation.
(A) Cell lysate from THP-1 macrophages treated with 100ng/ml of TNF for the indicated time points were subjected to western blot to detect status of phosphorylated FAK (phospho-FAK). The immunoblot is representative of three independent experiments with similar results. (B) Densitometric analysis of the western blot presented in Fig 3a. The densitometric quantification values for phospho-FAK immunoblot represent the ratio of phospho-FAK:FAK and the fold-induction was calculated after normalizing with the control 0h group. (C) Medium supernatant collected from RAW264.7 macrophages treated with TNF for 8h in the presence or absence (untreated vehicle control) of FAK inhibitor (5μM) was analyzed for CCL3 production by ELISA (n = 12; three independent experiments). (D) Medium supernatant collected from WT and FAK KO MEFs treated with TNF (10ng/ml;16h) was analyzed for IL-6 production by ELISA (n = 9; three independent experiments). (E) Cell lysate from WT and C25H KO BMDMs treated with TNF (100ng/ml) for the indicated time points were subjected to western blot to detect status of phosphorylated FAK (phospho-FAK). The immunoblot is representative of four independent experiments with similar results. (F) Densitometric analysis of the western blot presented in Fig 3e. The densitometric quantification values for phospho-FAK immunoblot represent the ratio of phospho-FAK:FAK and the fold-induction was calculated after normalizing with the control 0h group. ELISA data are shown as Mean ± SEM. *p ≤ 0.05 using a Student’s t-test. The densitometric values represent the mean ± SEM from four independent experiments. The p value shown in the figure was calculated using a Student’s t-test (*p and **p ≤ 0.05).

