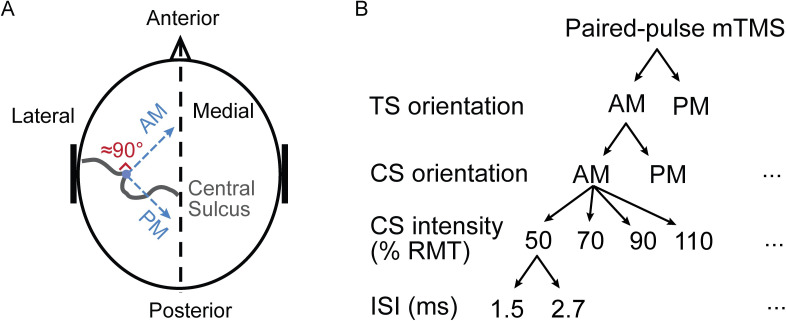
Fig 1. Experimental protocol.
(A) Schematic representation of the stimulus orientations. The APB hotspot is indicated as a blue dot. The AM orientation of the E-field is approximately perpendicular to the central sulcus (gray curve). The PM is oriented 90° clockwise from the AM. (B) Schematic representation of paired-pulse stimulation. Thirty-two paired-pulse configurations were utilized based on the following features: Two orientations of the CS: AM and PM; two orientations of the TS: AM and PM; four CS intensities: 50, 70, 90, and 110% RMT; two ISIs: 1.5 and 2.7 ms. The ellipsis indicates an intentional omission of the subdivision for all configurations, except for the first one.

