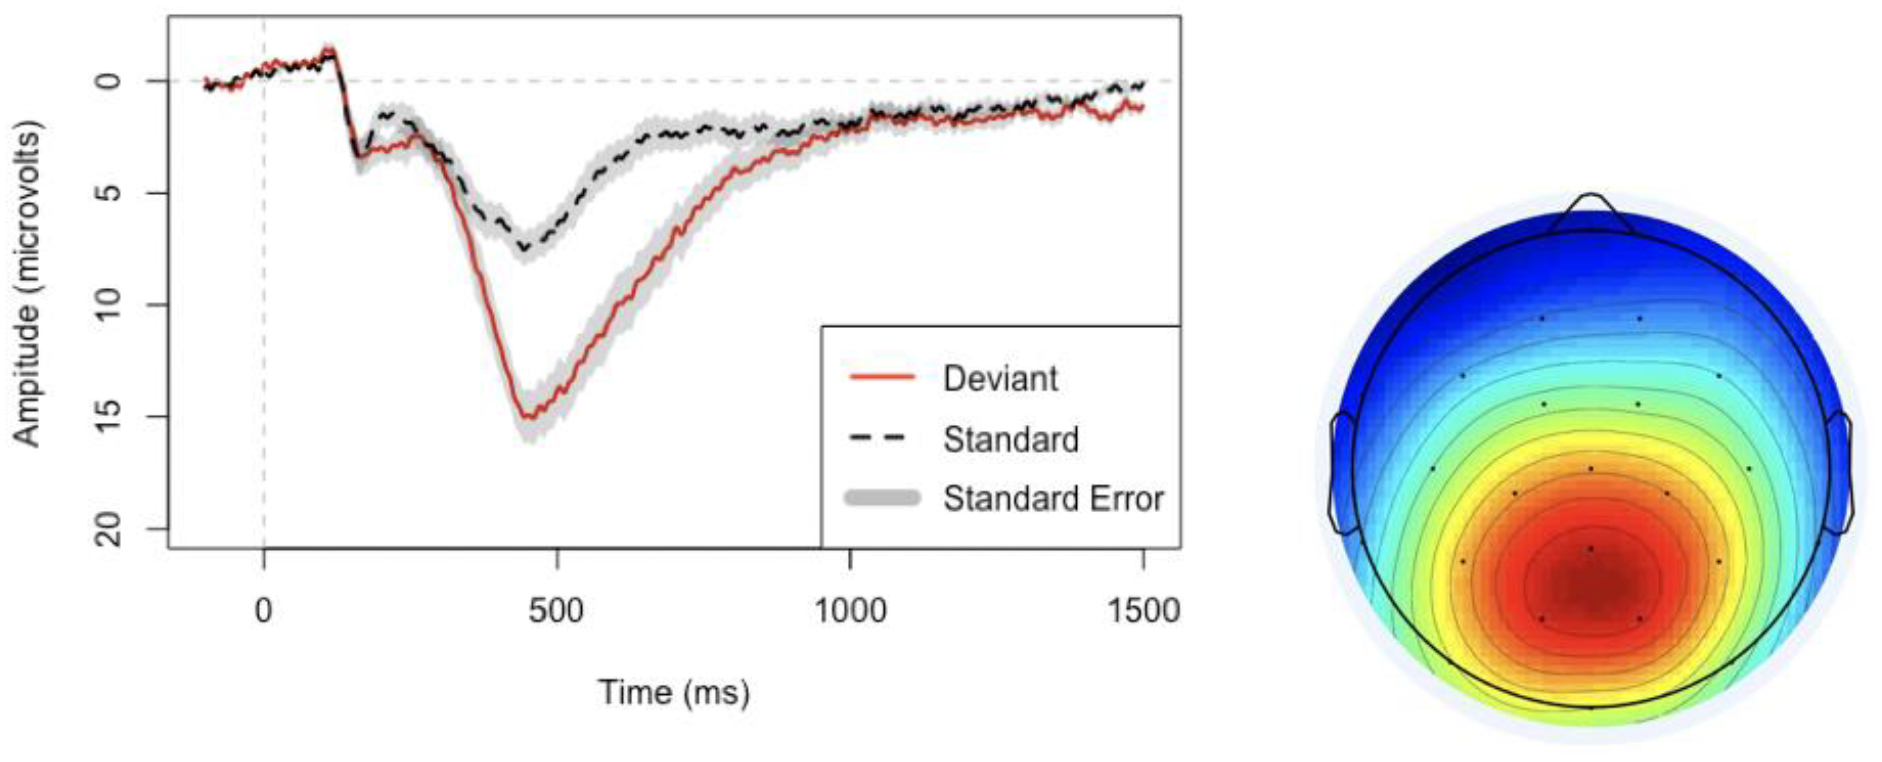
Figure 1.

Left: Grand average P3b response to standard (dashed) and deviant (solid) stimuli at electrode MiPa (Midline parietal, the equivalent of Pz in 10–20 system). Negative is plotted up. Gray shades represent standard error of the mean (using inter-individual averages). Baseline is pre-stimulus, −100 ms to 0 ms. Right: Grand average scalp map of the difference wave (deviant - standard) of the P3b response from 298–598 ms.
