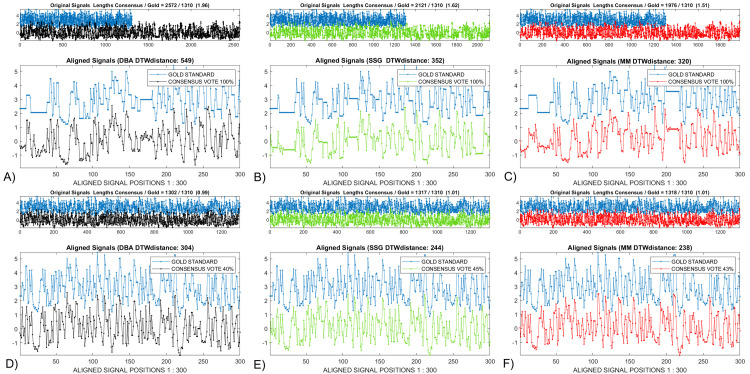
Fig 8.
The A) DBA, B) SSG and C) MM consensus signals from the Enolase study show some similarities and differences before voting. After voting, the D) DBA, E) SSG and F) MM consensus signals appear more visually similar, with only the DTWDISTANCE metric hinting at remaining differences in their relationship to the gold signal.

