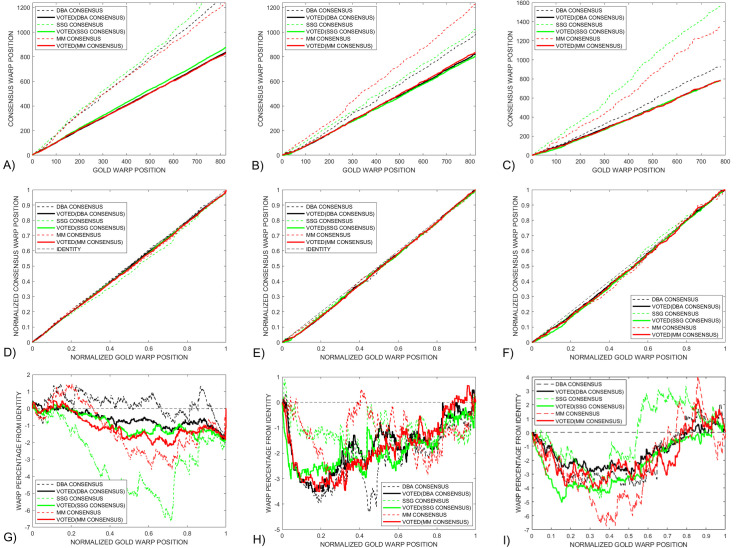
Fig 13. A comparison is made between various warp-path metrics for the Enolase, column1, Sequin R1-71-1, column 2, and Sequin R2-55-3, column 3, with normalized warp position calculated from their respective gold lengths.
The normal warp path display, Row 1, shows how the DBA, black, SSG, green, and MM, red, signals all gain more similar lengths upon voting. These changes are reflected in the normalized paths, Row 2, which show a drop in deviation from the Identity path after voting. The Difference-from-Identity warp paths, Row 3, shows that the three DTWA consensus signals become similar after voting.

