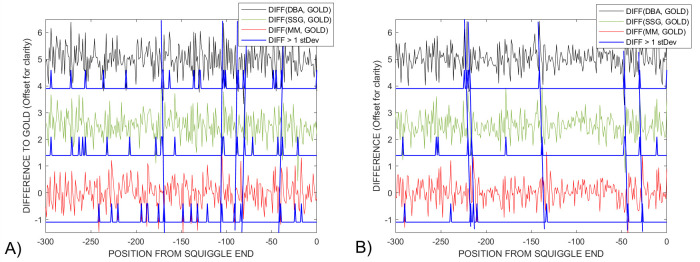
Fig 15.
Comparison of the differences between the amplitudes of the warped gold and DBA (black), SSG (green) and MM (red) voted-on DTWA consensus signals for Sequin A) R1-71-1 and B) R2-55-3 studies. The short blue spikes indicate where higher than average differences exist between the study’s gold standard and a consensus signal, many larger differences being common across all consensuses, blue lines. However, closer examination of all differences show that they cannot be represented as experimental produced gaussian deviations around a mean, but are equivalent, small systematic differences common across all DTWA consensuses.

