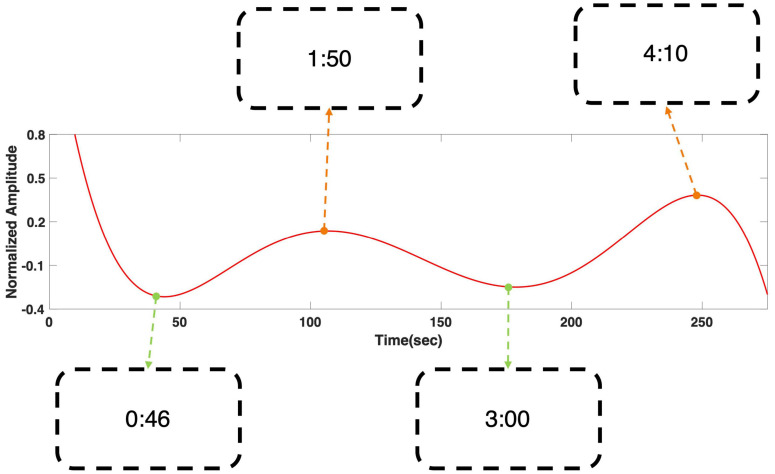
FIGURE 4.
Grand averaged polynomial regression result of SSVEP response at 6 Hz during “fear” movie screening. The minima corresponded with relatively ordinary scenes, while the maxima corresponded to the scenes with appearance of specter. The scenes corresponding to each local extrema can be found using the time stamps in the boxes. The time stamps correspond to the time points in the following movie clip: https://youtu.be/xeqwAVO0UFg.

