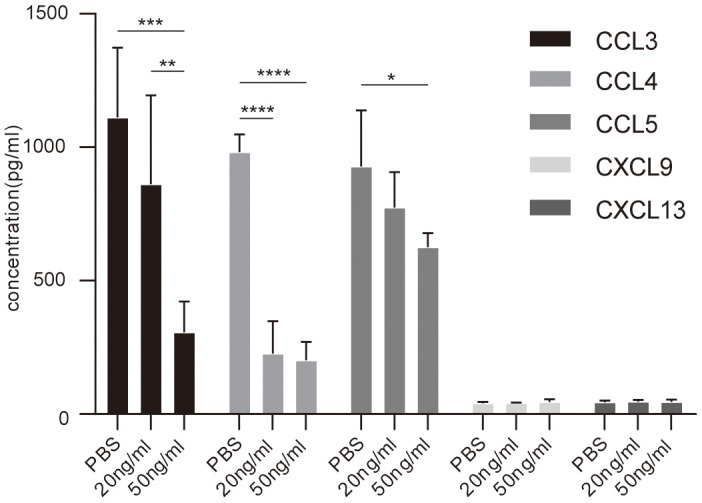
Figure 6.

Elisa analysis of chemokines concentration in PBMCs culture supernatant with or without IL-37 treatment. Columns and error bars represented mean±SEM. n=6 per group. *p< 0.05, **p< 0.01, ***p<0.001. Similar results were obtained from three independent experiments.
