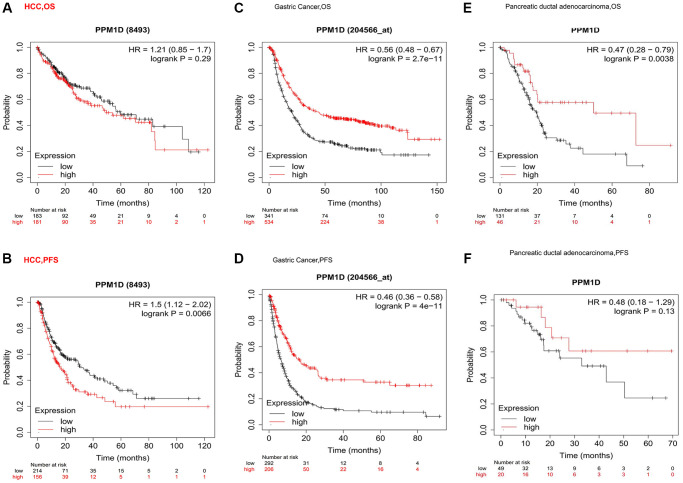
Figure 2.
Kaplan-Meier survival curve analysis of the prognostic significance of high and low expression of PPM1D in different types of human cancers using the Kaplan-Meier plotter database (A–F). (A, B) OS and High PPM1D expression was correlated with poor PFS in HCC (n = 364, n = 370). (C, D) Survival curves of OS and PFS survival curves in the gastric cancer (n = 875, n = 498). (E, F) OS and PFS survival curves in the Pancreatic ductal adenocarcinoma (n = 177, n = 69). Abbreviations: OS: overall survival; PFS: progression-free survival.

