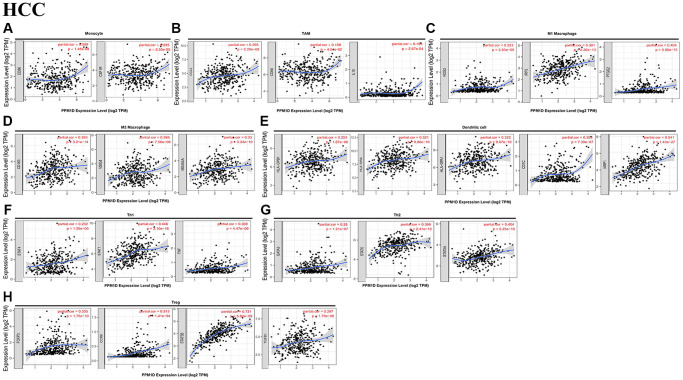
Figure 4.
Correlation analysis of PPM1D mRNA expression and the expression of marker genes of infiltrating immune cells in HCC (A–H) using the TIMER database. (A–G) The scatter plots show correlation between PPM1D expression and the gene markers of (A) Monocytes (CD86 and CSF1R); (B) TAMs (CCL2, IL-10 and CD68); (C) M1 Macrophage (NOS2, IRF5 and PTGS2); (D)M2 Macrophage (CD163, VSIG4 and MS4A4A); (E) DCs (HLA-DPB1, HLA-DRA, HLA-DPA1, CD1C and NRP1); (F) Th1 cells (STAT4, STAT1 and TNF); (G) Th2 cells (GATA3, STAT6 and STAT5A) and (H) Tregs (FOXP3, CCR8, STAT5B and TGFB1) in HCC samples (n = 371). PPM1D gene was on the x-axis and the related marker genes were on the y-axis.

