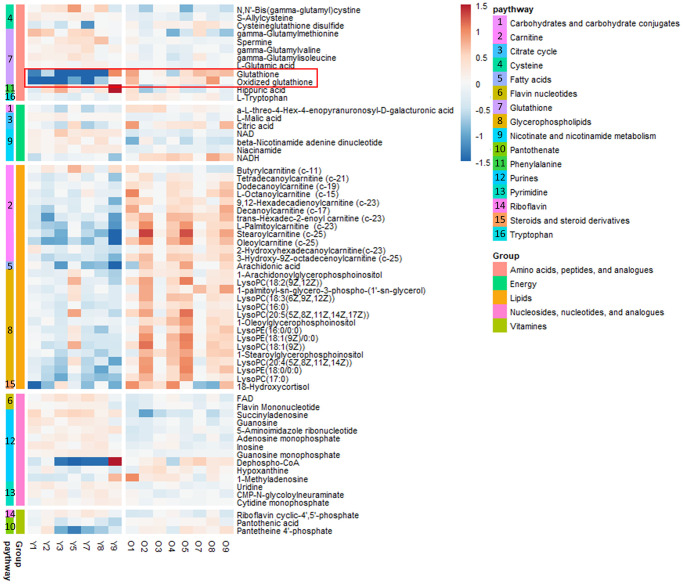
Figure 1.
Heat map of metabolites in the kidney tissues of young (n = 7) and old (n = 8) mice in vivo. The metabolites were plotted and further curated according to their residing KEGG pathways. The heat map was color-coded according to the log 2 transformed fold change in the measured relative intensities of each sample.

