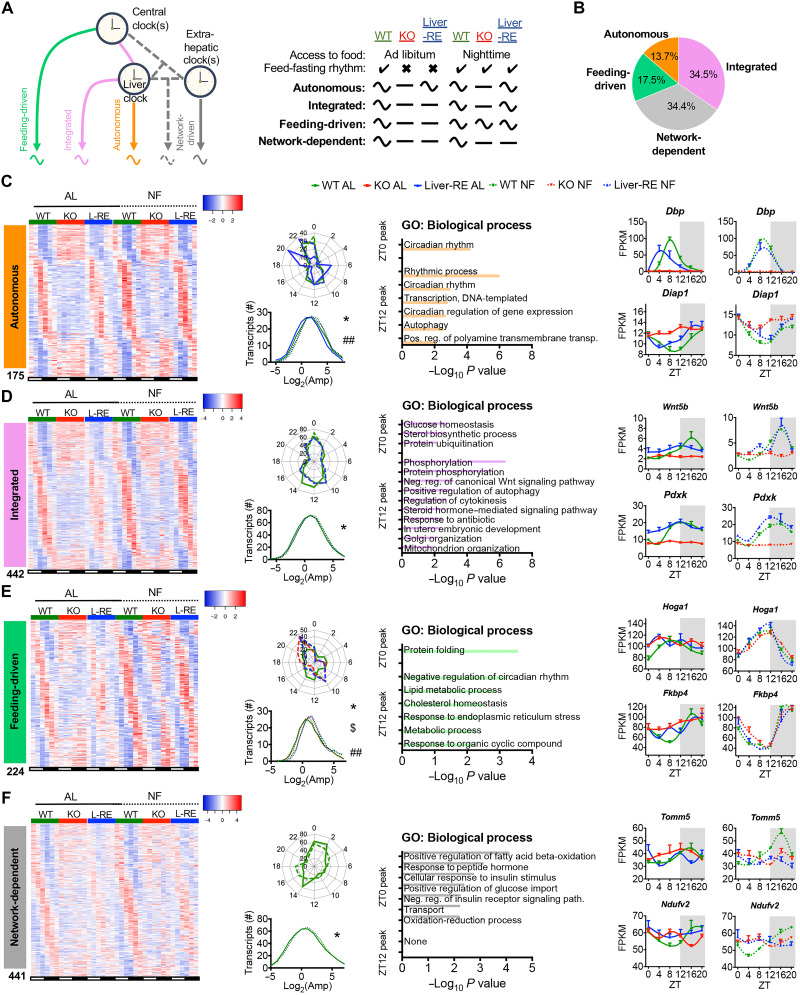
Fig. 2. Defining drivers of gene oscillations in the liver.
(A to F) Data presented are liver transcriptome at six time points over the diurnal cycle (ZT0, ZT4, ZT8, ZT12, ZT16, and ZT20) by RNA-seq (n = 3) and JTK_CYCLE rhythmicity detection (P < 0.01). (A) Gene classification scheme used to determine the drivers of oscillating genes in the liver. Curved and flat lines represent oscillating and nonoscillating genes, respectively. (B) Breakdown of oscillating genes by mechanism, displayed as the percentage of total oscillating in WT under either AL or NF. (C to F) Features of each set of oscillating genes. Left: Phase-sorted heatmap. Middle left: Polar histogram of peak phase and amplitude distribution (one-way ANOVA with Newman-Keuls post hoc tests: autonomous, *WT AL versus Liver-RE AL and ##Liver-RE AL versus NF; integrated, *WT AL versus NF; feeding-driven, *WT NF versus KO NF, $KO NF versus Liver-RE NF, and ##WT AL versus NF; network-dependent, *WT AL versus NF; *P < 0.05. Middle right: Pathway enrichment analysis for the two main peaks of gene expression detected (ZT0 peak = ZT20 to ZT4, ZT12 peak = ZT8 to ZT16, P < 0.01). Right: Example genes (means ± SEM, n = 3 per group, per time point).

