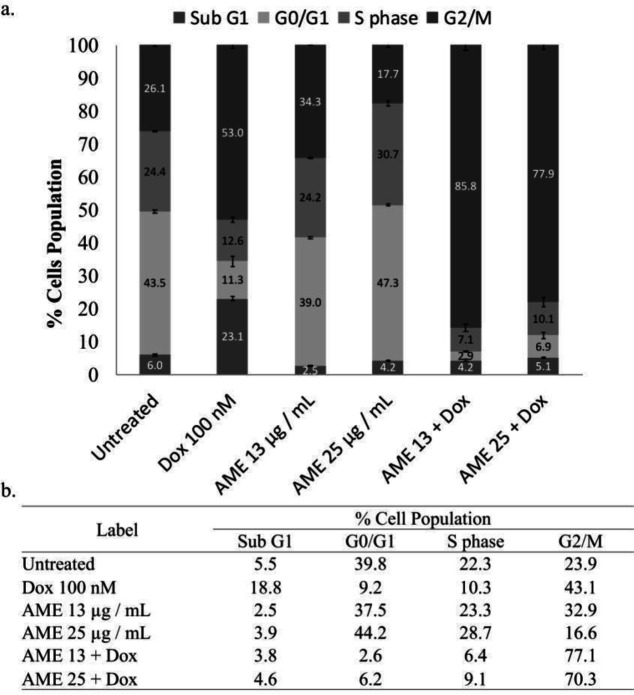
Figure 3.
Cell cycle distribution effect of AME alone and in combination with dox. (a) 4T1 cells (3 × 10³ cells/mL) were treated with 12.5 and 25 µg/mL of AME alone and in combination with 100-nM dox for 24 h and subjected to cell cycle analysis under PI staining with flow cytometry (n = 3). (b) The summarization of % cell population of 4T1 cells for each phase

