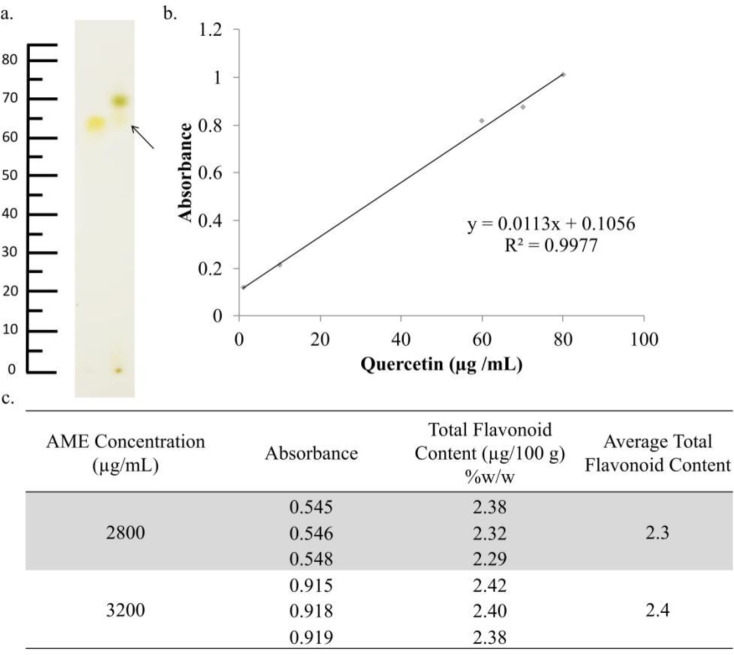
Figure 6.
Identification of the chemical content of AME. AME was identified using TLC, while the total flavonoids were determined using spectrophotometry. (a) TLC chromatogram of AME (2) and quercetin (1) showed relatively similar spots between quercetin as standard and AME with an Rf value 0.70. (b) The regression equation obtained from quercetin standard measurement (c) The total flavonoid determination indicated that the total flavonoid content of AME was 2.30% ± 0.05%.

