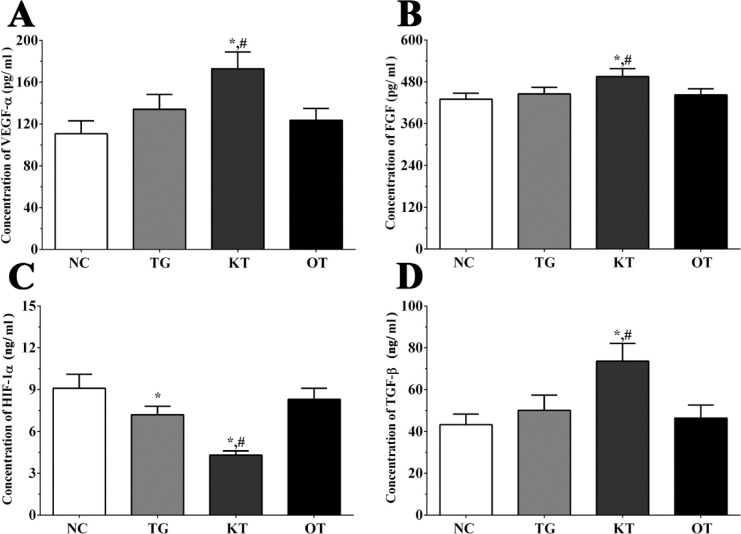
Figure 5.
Effect of taxifolin on expression of angiogenesis related factors in serum sample of mice model. (A) Concentration of VEGF-α. (B) Concentration of FGF. (C) Concentration of HIF-1α. (D) Concentration of TGF-β. *P < 0.05 vs. NC group, #P < 0.05 vs. TG group. Data was presented as a mean ± SD. Each experiment was repeated for three times independently

