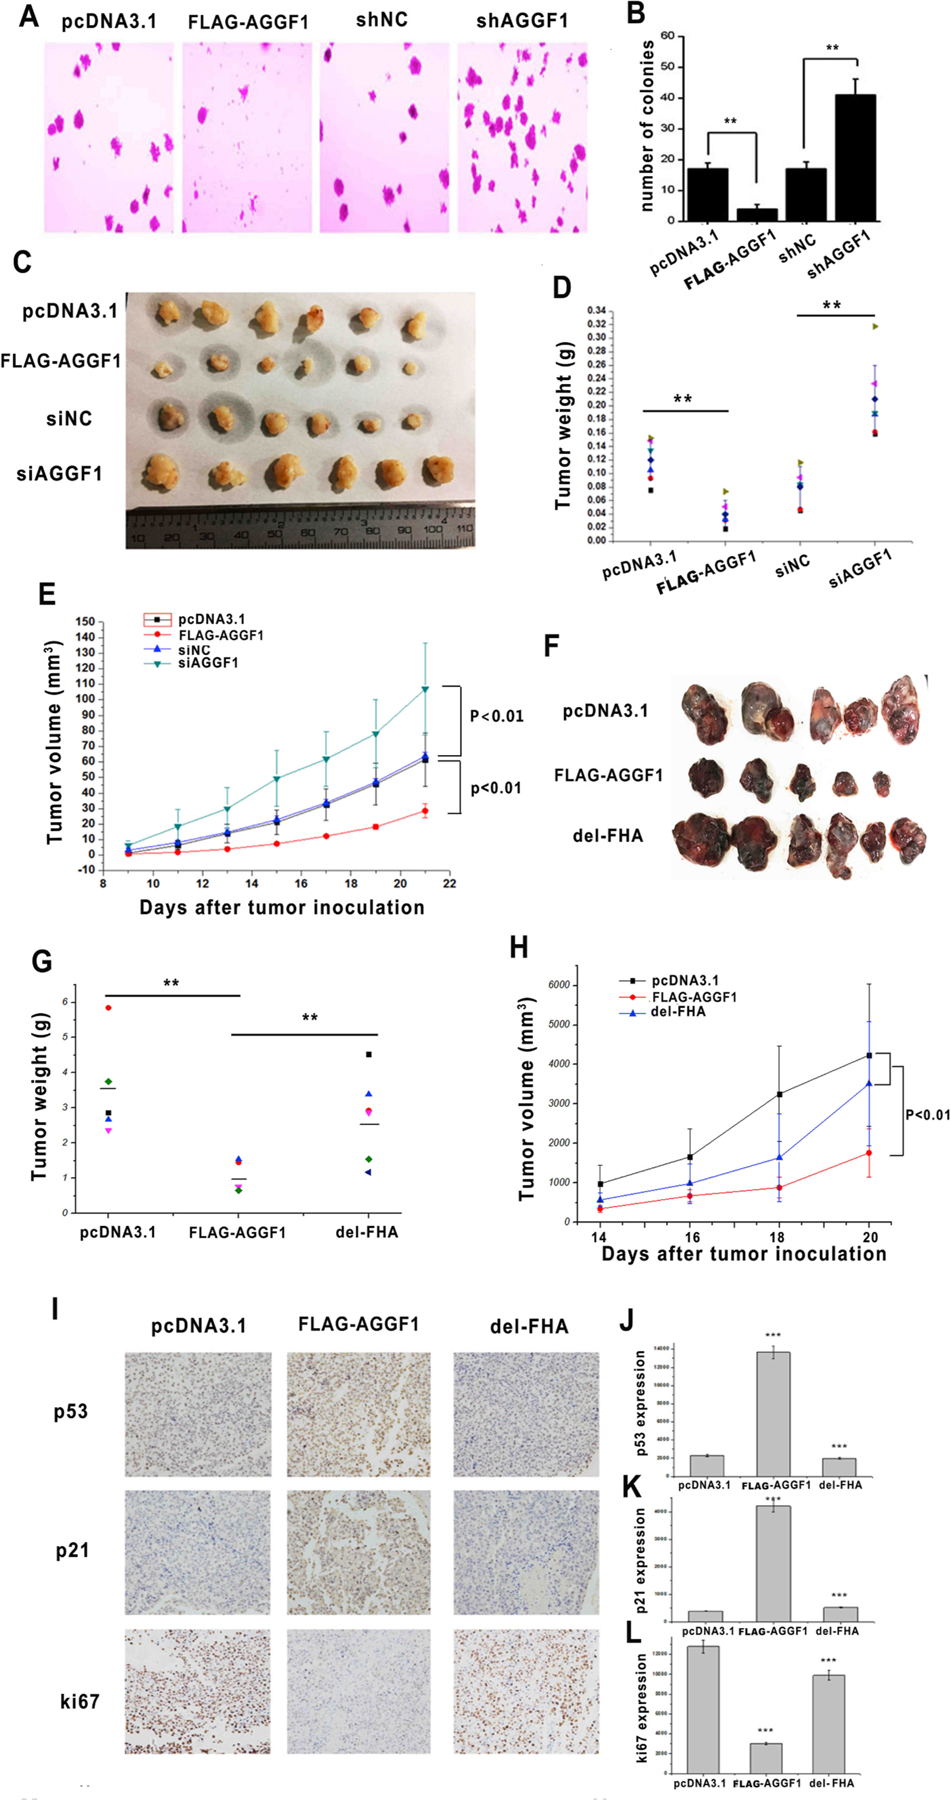
Fig. 1. Overexpression of AGGF1 suppresses tumor growth and knockdown of AGGF1 promotes tumor growth.

(A) Representative images of soft agar colony-formation assays with HCT116 cells transfected with an expression plasmid for FLAG-tagged AGGF1 vs. empty vector control (pcDNA3.1), AGGF1 shRNA or negative control shRNA. **P < 0.01, n = 3/group; NS, not significant.
(B) Quantification and statistical analysis of data from (A). (C-E) Transfected HCT116 tumor cells were implanted in nude mice (xenograft tumor model), and tumor growth was monitored (E). At day 22, the mice were sacrificed, tumors were excised, photographed (C), weighed and compared (D). **P < 0.01, n = 6/group. (F–H) Tumor growth analysis in C57BL/6J mice with B16–F0 cells transfected with an expression plasmid for FLAG-tagged wild type AGGF1, mutant AGGF1 without the FHA domain (del-FHA) or empty vector control pcDNA3.1 (CTRL). **P < 0.01, n = 5–6/group. (I) Representative images from immunostaining of tumor sections with anti-p53, anti-p21 or anti-Ki67 antibody. (J-L) Quantified data of images as in (I) are shown for p53 (J), p21 (K), and Ki67 (L). ***P < 0.001, n = 6/group.
