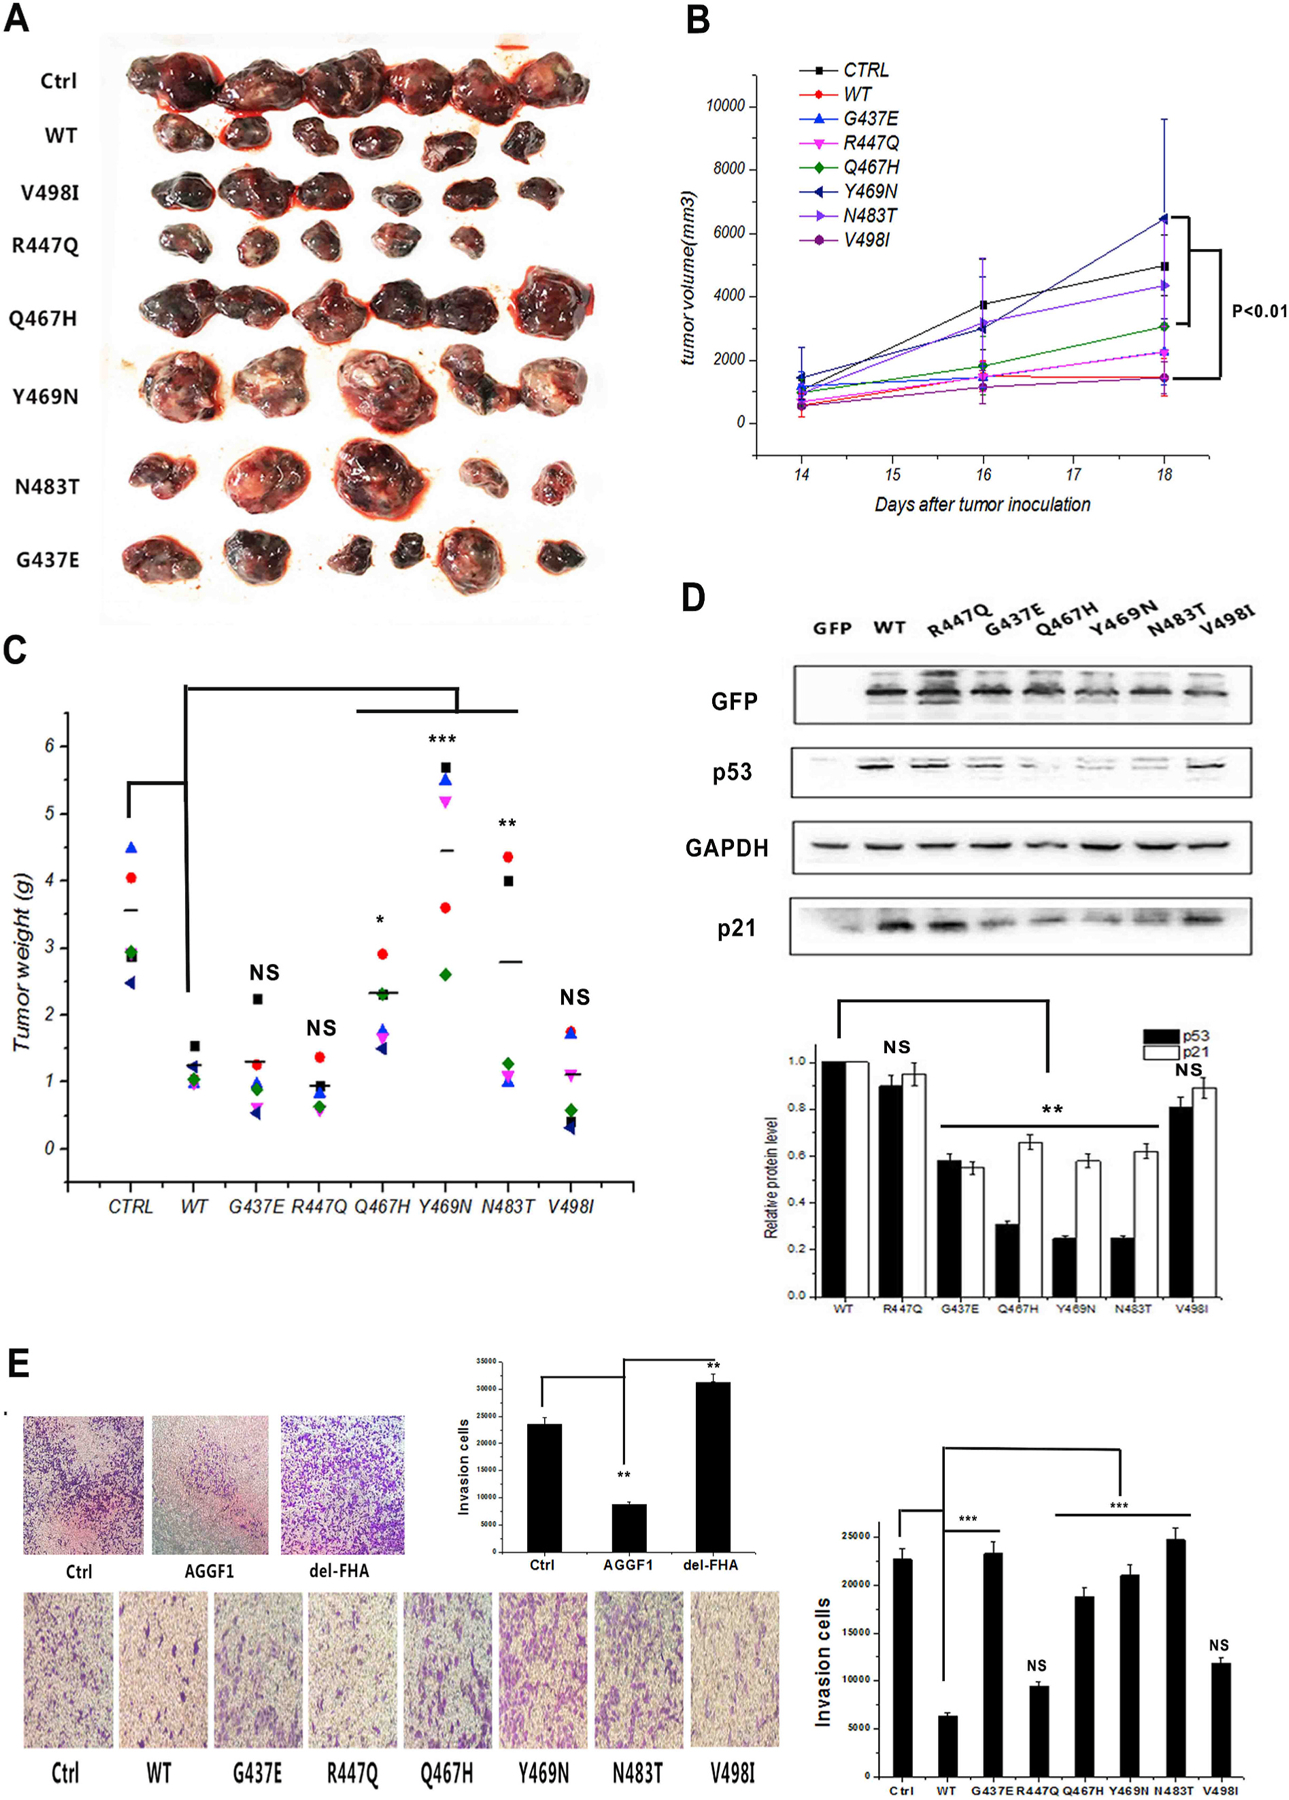
Fig. 5. Human tumor somatic mutations in the AGGF1 FHA domain attenuate the tumor suppressing effect of AGGF1.

(A-C) Tumor growth analysis in C57BL/6J mice with B16–F0 cells with overexpression of wild type AGGF1 (WT vs. control Ctrl) and six AGGF1 somatic mutations in the FHA domain. (A) Images of tumors excised from mice at the end of the study (day 18). (B) Tumor growth as measured by the tumor volume at different time points. (C) Tumor weight at the end of the study. B16–F0 cells transfected with an expression plasmid for FLAG-tagged wild type AGGF1, mutant AGGF1 without the FHA domain (del-FHA) or empty vector control pcDNA3.1 (CTRL). **P < 0.01, n = 5–6/group.
(D) Western blot analysis showing the effects of six AGGF1 mutations in the FHA domain on the expression levels of p53 and p21. GAPDH was sued as loading control. Quantifications were normalized to GAPDH and show as relative density (bottom).
(E) Representative images for tumor cell invasion assays using HCT116 cells transfected with an expression plasmid for wild type AGGF1, mutant AGGF1 with the FHA domain deleted or empty vector control (Ctrl). Quantification of invasion cells was shown (right).
