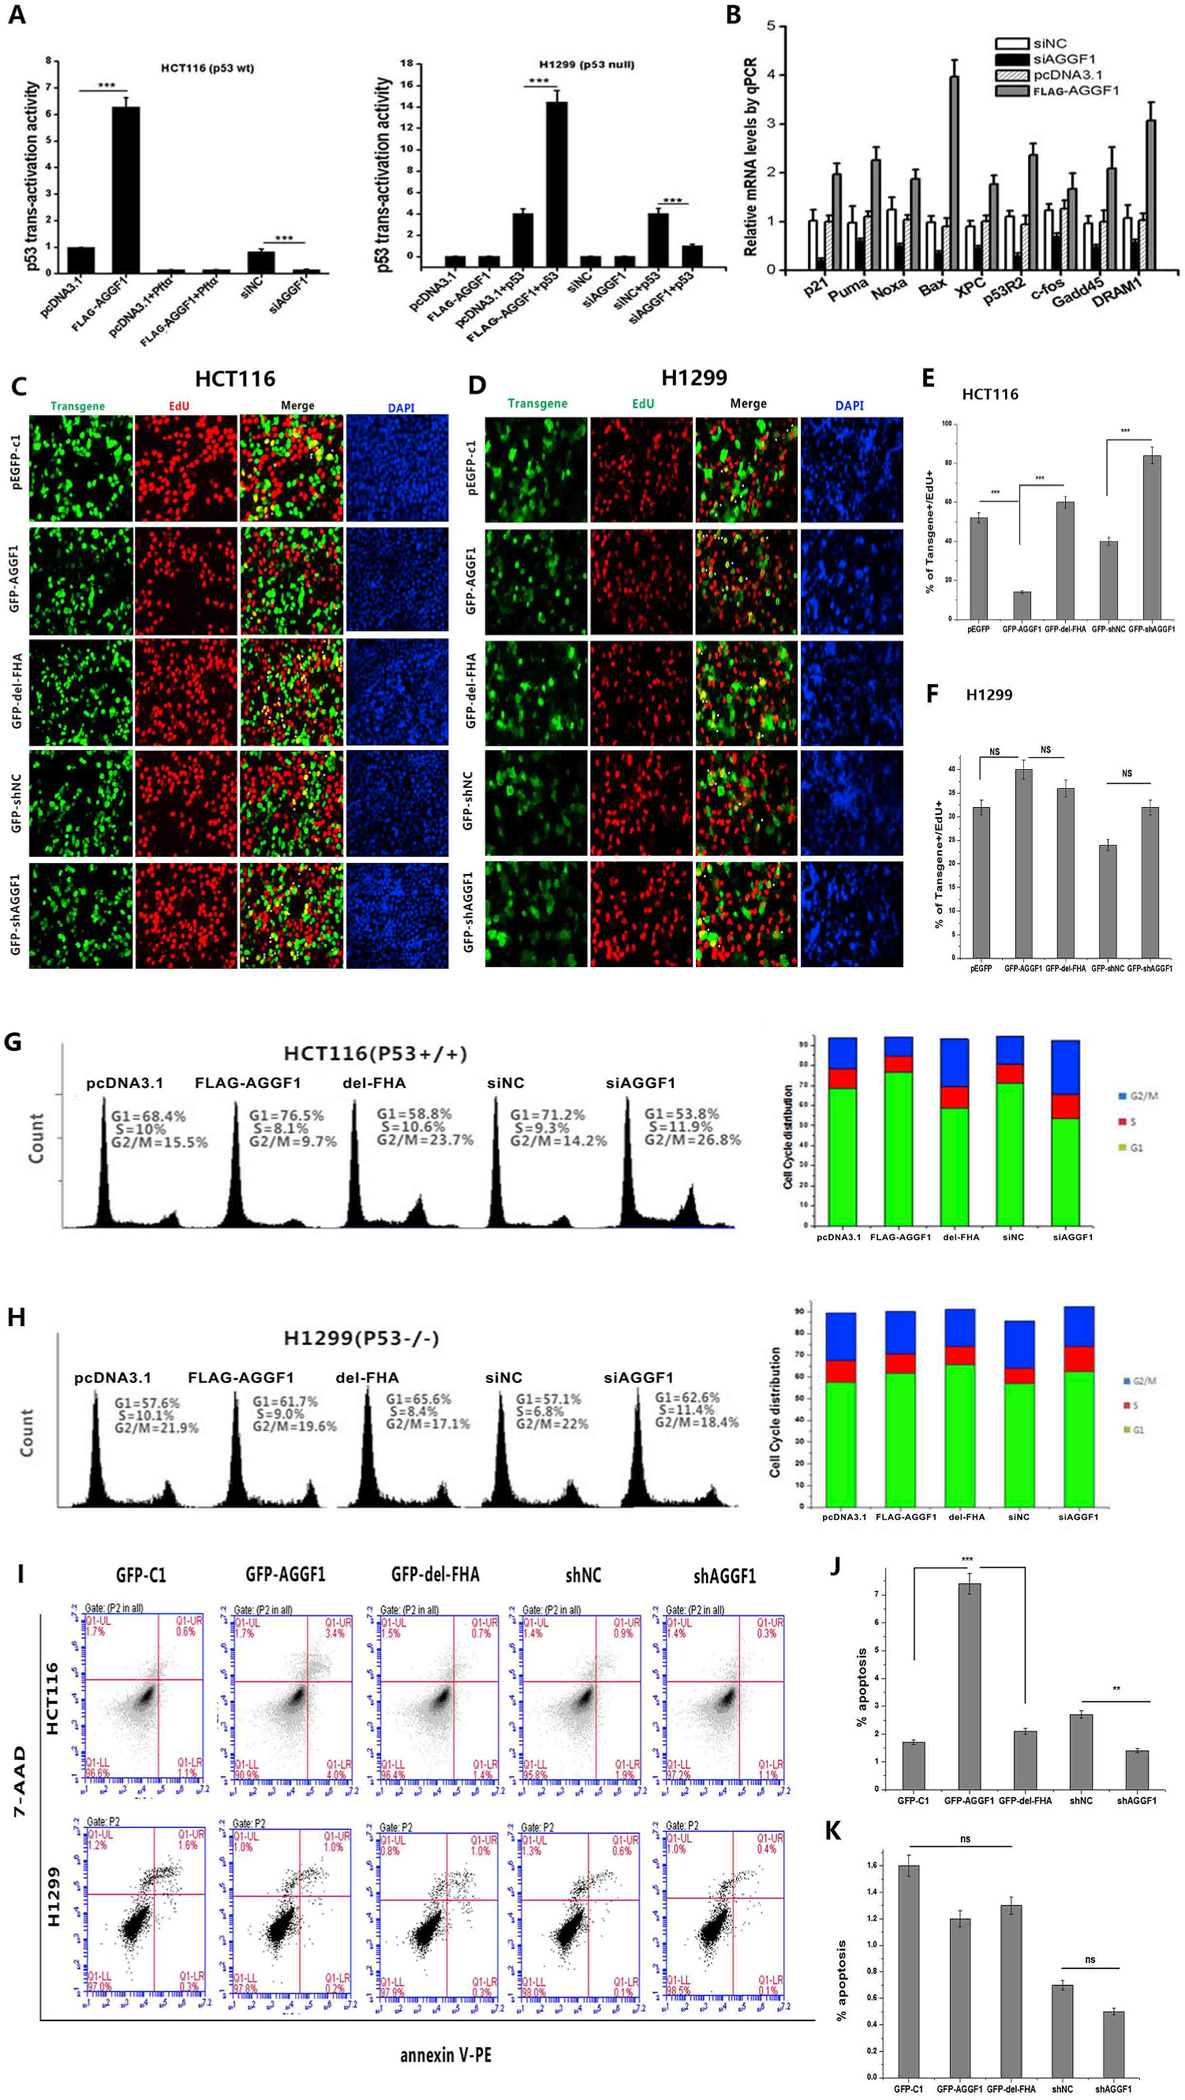
Fig. 6. AGGF1 regulates tumor cell growth depending on p53. (A) HCT116 cells with a high level of p53 expression were co-transfected with a TP53 promoter luciferase reporter (p53-luc), pRL-TK, a FLAG-AGGF1 expression plasmid vs. pcDNA3.1 vector control or AGGF1 siRNA (siAGGF1) vs. negative control siRNA (siNC) for 48 h, and lysed to prepare cellular extracts for luciferase assays to measure the transcription activation activity of p53 (left). PFT-α, an inhibitor of p53. Similar assays using H1299 cells without expression of p53 (right).

(B) Real-time RT-PCR analysis for TP53 downstream genes in HCT116 cells with overexpression of FLAG-AGGF1 vs. pcDNA3.1 control or knockdown of AGGF1 using siAGGF1 vs. siNC.
(C) Representative images of cell proliferation assays using EdU cell proliferation assays, which measure the incorporation of EdU into newly synthesized DNA in HCT116 cells transfected with plasmids for overexpression of GFP-AGGF1 or mutant GFP-AGGF1 without the FHA domain vs. empty pEGFP-c1 vector control, shRNA for AGGF1 (GFP-shAGGF1) vs. empty vector control (GFP-shNC).
(E) Experimental data as in (C) were quantified and plotted.
|(D) Similar cell proliferation assays but in H1299 cells without p53 expression.
(F) Experimental data as in (D) were quantified and plotted. ***, P < 0.001, n = 3/group; NS, not significant.
(G) Representative flow cytometry images of cell cycle assays using HCT116 cells transfected with plasmids for overexpression of GFP-AGGF1 or mutant GFP-AGGF1 without the FHA domain vs. empty pEGFP-c1 vector control, shRNA for AGGF1 (GFP-shAGGF1) vs. empty vector control (GFP-shNC). Experimental data were quantified and plotted.
(H) Similar cell cycle assays but in H1299 cells without p53 expression. Experimental data were quantified and plotted. ***, P < 0.001, n = 3/group; NS, not significant.
(I) Representative images of apoptosis assays using HCT116 cells transfected with plasmids for overexpression of GFP-AGGF1 or mutant GFP-AGGF1 without the FHA domain vs. empty pEGFP-c1 vector control, shRNA for AGGF1 (GFP-shAGGF1) vs. empty vector control (GFP-shNC) (top). Similar cell cycle assays but in H1299 cells without p53 expression (bottom).
(J) Experimental data as in (I, top) were quantified and plotted.
(K) Experimental data as in (I, bottom) were quantified and plotted. ***, P < 0.001, n = 3/group; NS, not significant.
